
Plain language summay of
Assessing Consequences of Human Activity on Wildlife Populations
By Forest and Rangeland Ecosystem Science Center
January 6, 2021
Human activity sometimes stresses or kills individual animals. Most of the tools we have to address this problem are focused on those individuals. We have limited ways to understand how human activity impacts wildlife populations. USGS scientists have developed a new tool to help managers understand the effects of human stressors on wildlife populations.
USGS scientists built a five-step framework to allow managers to use field data on individuals to understand population-level demographic effects. This framework is broadly applicable to a wide range of human-derived stressors to wildlife – impacts of renewable energy on wildlife, roadway mortality of birds or insects, or any other stressors that affect terrestrial or flying mammals or birds.
The Five Steps
- Frame the problem
- Work with managers to identify key populations, assessment parameters, anthropogenic stressors and stakeholder needs.
- Collect field-based measurements
- Use a rigorous experimental design to allow effective comparison of demographic effects with and without the stressor.
- Identify the populations affected by the stressor – where are they and how many individuals are there?
- Identify origins of affected individuals – stable hydrogen isotopes, genetics, marking, etc.
- Estimate the size of the affected populations.
- Build demographic models for the affected populations.
- Most approaches are fine - traditional population variability analysis (PVA), Leslie matrix models, modern Bayesian approaches, etc.
- Assess the significance of the stressor on those affected populations.
- Link demographic effect, such as number of fatalities, to the size of affected populations.
- Compare population trajectories with and without the stressor.
| Why this tool is unique It is the first tool to incorporate the origin of affected animals as part of a framework to understand demographic effects of human activity on wildlife. Results help frame potential management and mitigation strategies, which will differ if human activity is killing wildlife from local vs. distant populations. |
Application

Sources/Usage: Some content may have restrictions. View Media Details
This framework was initially developed to assess impacts of renewable energy for avian and bat populations. However, the tool can be applied to any situation where wildlife are impacted by humans, including activities such as urbanization, legal or illegal shooting, and vehicle collisions.
As an example, consider the effects to red-tailed hawk populations from wind energy facilities in central California.
About 170 red-tailed hawks are reported killed every year at a group of wind turbines. The total red-tailed hawk population of North America is about 2.8 million individuals.
How does one determine if those 170 deaths per year matter to the entire population of hawks in North America?
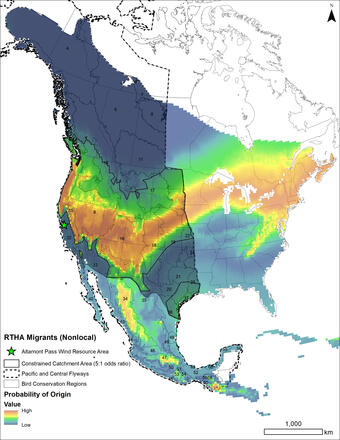
USGS scientists used an inexpensive stable hydrogen isotope analysis to determine the origins of the 170 red-tailed hawks killed at the site. Isotope data suggested that 37% of the birds killed were from the local Bird Conservation Region (BCR). The other 63% grew their feathers far from the site where they died, meaning they were non-local in origin.
Sources/Usage: Public Domain. View Media Details
The isotope data can be used to help estimate areas where those birds originated. These areas are represented by the red, yellow, and green areas on the heat map to the right. The heat map data, together with data on population size in each BCR, are used to estimate the total number of birds in each population of origin. In other words, the scientists estimated the total number of birds in the local and non-local populations of origin.
In this example, the size of the non-local population of red-tailed hawks is much bigger than the size of the local population and a larger proportion of birds killed were from that non-local population. That said, USGS analyses suggest that even though proportionally fewer local birds die, the local population is more vulnerable to consequences from deaths at this group of wind turbines. However, that is not always the case – for some species the non-local population is more vulnerable.
A key feature of this unique analytical framework is its use of geolocation data, such as stable hydrogen isotopes, in demographic models that inform about effects of human stressors on wildlife populations.
THIS BRIEF REFERS TO:
Katzner, T.E., Braham, M.A., Conkling, T.J., Diffendorfer, J.E., Duerr, A.E., Loss, S.R., Nelson, D.M., Vander Zanden, H.B., Yee, J.L., 2020, Assessing population-level consequences of anthropogenic stressors for terrestrial wildlife: Ecosphere, v. 11, no. 3, p. e03046, https://doi.org/10.1002/ecs2.3046.
If you are unable to access a product or publication online, you can request a copy by sending an email with your contact information and the publication’s citation to fresc_outreach@usgs.gov or call (541) 750-1030.
Click on the Multimedia tab for a printable version of this webpage.
Related Content
Katzner, et al. 2020 Publication Brief
Related Content
Katzner, et al. 2020 Publication Brief
Plain language summay of
Get Our News
These items are in the RSS feed format (Really Simple Syndication) based on categories such as topics, locations, and more. You can install and RSS reader browser extension, software, or use a third-party service to receive immediate news updates depending on the feed that you have added. If you click the feed links below, they may look strange because they are simply XML code. An RSS reader can easily read this code and push out a notification to you when something new is posted to our site.