U.S. flag

An official website of the United States government

Photo and Video Chronology - Kilauea - February 4, 1998

February 4, 1998

In the aftermath of a surge. Surge of magma from Kilauea's summit downrift to Pu`u `O`o on January 14; Kilauea Volcano's east rift zone only now returning to a typical pattern of behavior.

Aerial oblique view of Pu`u `O`o cinder-and-spatter cone
Aerial oblique view of Pu`u `O`o cinder-and-spatter cone, looking west. Visible in foreground are crater overflows that occurred chiefly in 1997, now armoring the east flank of Pu`u `O`o. The feature known as "crater vent" is the heavily fuming area in upper left of crater depression. Only scant fresh lava was visible in the crater vent when this photo (p0852) was taken January 30, 1988. Distance across crater is about 200 m (left to right). (Public domain.)

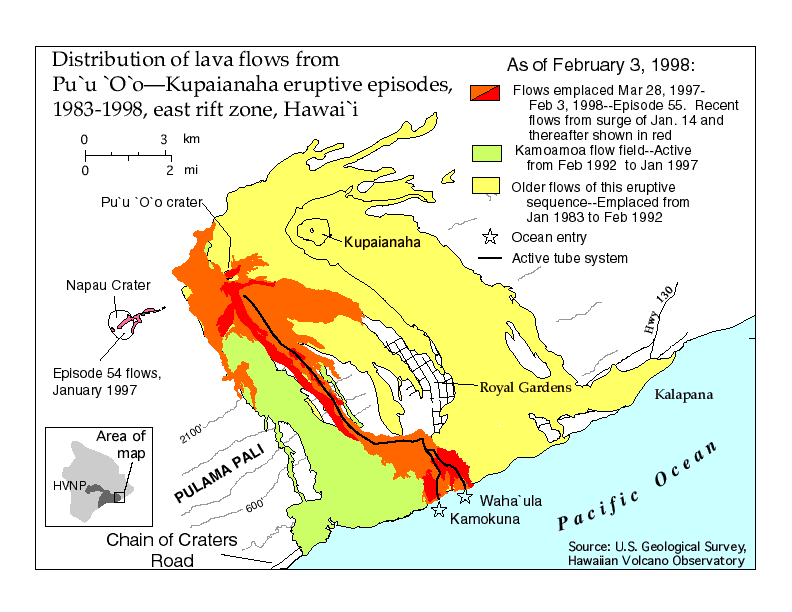
[This update current as of February 4, 1998. Eruption updates are posted approximately every two weeks. More frequent updates will accompany drastic changes in activity or increased threat to residential areas.}

On January 14 at 6:15 p.m., a surge of mama disturbed the upper crust beneath Kilauea caldera. Immediate effects, occurring in the subsequent 12 hours, included a swarm of earthquakes (mostly magnitude 1-2, largest 2.2) at the summit of Kilauea and discharge of lava from vents on the south side of Pu`u `O`o, 17 km to the east. The earthquakes and surge disturbed the equilibrium of the eruption, an effect only now subsiding as the eruption returns to a pattern more typical of previous months. All these events are part of Episode 55, the eruptive episode that began February 24, 1997, and is continuing today. If you wish to learn more of the seismic, tilt, and eruptive events that occurred January 14-16, check the Jan. 17 archive.

Tilt record from summit tiltmeter at Uwekahuna vault, northwest edge of Kilauea caldera.
Tilt record from summit tiltmeter at Uwekahuna vault, northwest edge of Kilauea caldera. Tilt is recorded in microradians; one radian equals 57.3 degrees. (For those unfamiliar with tilt units, one microradian is roughly the tilt created by inserting a dime beneath the end of one-kilometer-long board.) The tilt record shows the abrupt inflation and deflation of Kilauea's summit area on the evening of Jan. 14, two weeks of episodic summit inflation and deflation, and finally low tilt rates following the Jan. 27 earthquake swarm near Namakani Paio campground. (Public domain.)

In the three weeks since January 14th

  • The summit of Kilauea Volcano has slightly inflated and deflated several times over periods of hours to days. In contrast, during previous months the summit typically showed only minor changes as the eruption proceeded in a more steady-state routine.
  • Supply of lava to the tube system was interrupted at least twice, coincident with episodes of summit inflation and deflation.
  • At the coast, the dwindling supply of lava to the tube system resulted in diminished discharge of lava to the ocean. Consequently, the steam plumes that commonly billow from the lava-water interface periodically weakened and vanished for a day or two at a time.
  • Beginning at 5:39 p.m. on January 27 and persisting into January 28, a swarm of earthquakes struck the area beneath Namakani Paio campground, 2 km northwest of Kilauea Volcano's summit. Several of these earthquakes rattled houses in the area and were felt from Hilo to Ocean View Estates, sites 40-50 km from the epicenter. The largest earthquake of the sequence, magnitude 4.4, occurred shortly after 8:00 p.m. on January 27.
Map showing earthquake epicenters for January 1998
Map showing earthquake epicenters for January 1998. Symbol style corresponds to focal depth; symbol size corresponds to magnitude. Shading shows contrasting geographic locus for January 14 summit earthquake swarm and January 27 earthquake swarm near Namakani Paio campground, all within Hawai`i Volcanoes National Park. (Public domain.)

The most obvious change visible to visitors at the National Park has been the numerous breakouts of lava along the coastal plain. In the days and weeks following the January 14 surge, fluctuating lava supply to the tube system periodically overwhelmed the tubes. On these occasions, lava upwelled, punched through weak zones in the tubes' roofs, and spread slowly outward on the ground surface. The coastal plain is highly subject to such breakouts because the tubes approach the plain by traversing down high, steep slopes. Elevation contrasts of nearly 500 m create substantial hydraulic head, adding additional force to lava when it fills the tubes.

Eruption-viewing opportunities change constantly, so those readers planning a visit to the volcano should contact Hawai`i Volcanoes National Park for the most current eruption information (808-985-6000). Additional photographs and descriptions of east rift eruptive activity may be found on the University of Hawai`i's web site.


Aerial oblique view of Pu`u `O`o cinder-and-spatter cone
Aerial oblique view of Pu`u `O`o cinder-and-spatter cone, looking west. Visible in foreground are crater overflows that occurred chiefly in 1997, now armoring the east flank of Pu`u `O`o. The feature known as "crater vent" is the heavily fuming area in upper left of crater depression. Only scant fresh lava was visible in the crater vent when this photo (p0852) was taken January 30, 1988. Distance across crater is about 200 m (left to right). (Public domain.)
Vent-fed `a`a lava flow from January 14, 1998
Vent-fed `a`a lava flow from January 14 surge on left; on right is tube-fed pahoehoe lava that oozed from a weakened part of tube that same evening. Main direction of spread for both lava flows is toward the viewer. Forest adjacent to flow in upper left corner killed and partly burned by heat from the lava. Pre-January `a`a forms isolated, more reddish-brown areas within expanse of the January 14 lava. Skylight into lava tube visible at lower right. Field of view about 500 m across center of photo. Photograph p0766, January 22, 1998. (Public domain.)


Flow-field map showing lava emplaced since January 14, 1998
Flow-field map showing lava emplaced since Jan. 14 (red), other lava of episode 55 (orange), and lava from previous episodes of the 15-year-long ongoing eruption on Kilauea Volcano's east rift zone. The map and many of the photos on the update page are anchors to larger images.


Photograph of coastal plain breakouts and ocean entry sites.
Coastal plain breakouts and ocean entry sites. Photograph p0837 (Jan. 29, 1998), an oblique aerial view east-southeast with steam plumes at Waha`ula and east Kamokuna entries in background. New flows in middle ground present silvery aspect; all new flows emanated from lava tubes that cross the coastal plain. Field of view is about 3 km at coastline. (Public domain.)


Photograph of ocean entry sites.
Coastal plain breakouts and ocean entry sites. Photograph p0840 (Jan. 29, 1998), a near-vertical oblique view southwest along coastline, with Waha`ula entry in foreground and east Kamokuna entry 900 m distant in background. Discoloration in ocean results as lava flows are disrupted by steam explosions and wave action along the shoreline. Some of the resultant debris drifts along shore to build new black sand beaches. (Public domain.)


Get Our News

These items are in the RSS feed format (Really Simple Syndication) based on categories such as topics, locations, and more. You can install and RSS reader browser extension, software, or use a third-party service to receive immediate news updates depending on the feed that you have added. If you click the feed links below, they may look strange because they are simply XML code. An RSS reader can easily read this code and push out a notification to you when something new is posted to our site.