
Striking New Seafloor Imagery of the Queen Charlotte-Fairweather Fault in the Gulf of Alaska
In 2016 the USGS led two geophysical surveys of the Queen Charlotte-Fairweather fault off the coast of southeast Alaska, using multibeam sonar to map the ocean floor in detail, and multichannel seismic reflection to image deeper layers of sediment.
This article is part of the January-February 2017 issue of the Sound Waves newsletter.

In the spring and summer of 2016, the USGS led two geophysical surveys of the Queen Charlotte-Fairweather fault off the coast of southeast Alaska. We used multibeam sonar to map the ocean floor in detail, and multichannel seismic reflection to image deeper layers of sediment. Our goals included determining how fast the two sides of the fault move past each other (slip rate) and deciphering the history of the fault. We also want to better understand how large earthquakes might trigger potentially dangerous underwater landslides.
The Queen Charlotte-Fairweather fault extends more than 1,200 kilometers (750 miles) from offshore of Vancouver Island, Canada, to the Fairweather Range of southeast Alaska. This fault can be considered a sister to California’s San Andreas fault: both separate the Pacific tectonic plate from the North American plate; both are right-lateral strike-slip faults (one side moves to the right relative to the other); and both can generate large, dangerous earthquakes.


This project began in 2015 with two geophysical surveys along the northernmost submerged section of the fault (see “Investigating the Offshore Queen Charlotte-Fairweather Fault System”). This year we expanded the project by extending the survey area 325 kilometers (200 miles) to the south. We continue to work with last year’s partners—the Alaska Department of Fish and Game, the Geological Survey of Canada, and the Sitka Sound Science Center—and have added a new partner: the University of California, Santa Cruz. We are also collaborating with USGS geologists studying on-land segments of the fault (for example, see “Uncharted: Exploring one of America’s fastest faults”). Scientists from both the onshore and offshore projects presented results at the American Geophysical Union Fall Meeting in December 2016.
First cruise: 25 days of around-the-clock work pay off
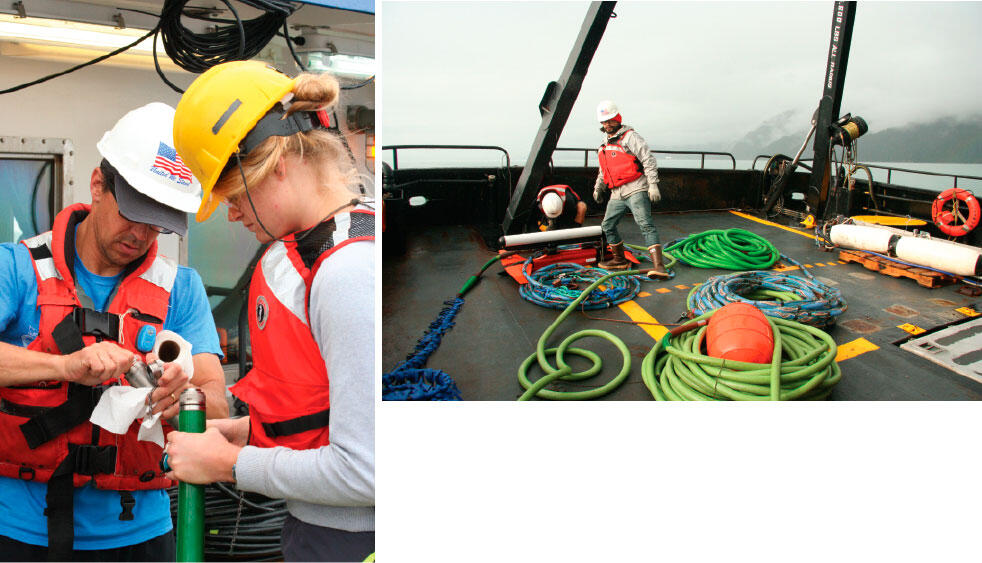
The first survey in May and June of 2016 (USGS Survey 2016-625-FA) was a cooperative effort between the Alaska Department of Fish and Game (ADFG) and the USGS, using ADFG’s research vessel R/V Medeia out of Juneau, Alaska. Scientists Danny Brothers, Jared Kluesner, Jackson Currie, and Rob Wyland from the USGS Pacific Coastal and Marine Science Center; Uri ten Brink and Brian Andrews from the USGS Woods Hole Coastal and Marine Science Center; and Peter Haeussler from the USGS Alaska Science Center worked with four R/V Medeia crewmembers from Fish and Game, and two hydrographic surveyors from the TerraSond LLC. The team used a Reson 7160 multibeam echosounder to map bathymetry (seafloor depth) and backscatter (an indicator of seafloor texture and composition). A high-resolution seismic-reflection system—consisting of a 32-channel hydrophone streamer and a sparker sound source—was used to collect seismic-reflection profiles (vertical images of sediment layers beneath the seafloor). Both systems ran simultaneously throughout the cruise.
We began gathering data along the northwest coast of Chichagof Island, where we had mapped 75 kilometers (50 miles) of the Queen Charlotte-Fairweather fault in 2015 (see “Investigating the Offshore Queen Charlotte-Fairweather Fault System in Southeastern Alaska, and its Potential to Produce Earthquakes, Tsunamis, and Submarine Landslides”), and then continued southward along the fault for an additional 325 kilometers (200 miles). The 110-foot R/V Medeia proved an excellent platform for field operations, allowing us to collect data in less-than-ideal weather conditions. At the midpoint of the survey, we docked in nearby Sitka for one night to resupply and exchange personnel. Only once did we stop for bad weather, when seas of 4 to 5 meters (13 to 16 feet) and 40-knot winds with 65-knot gusts forced us to head into safe harbor on Baranof Island. In total, we completed 25 days of 24-hour operations.
Remarkable results

Despite the often-difficult weather and sea conditions, we collected more than 4,600 square kilometers (1,700 square miles) of multibeam bathymetry and backscatter data. The bathymetric data provide remarkable new views of the shape and extent of the Queen Charlotte-Fairweather fault. We immediately saw several previously unknown features, including a series of subtle bends and steps in the fault that appear to form basins within the fault zone. Perhaps the most intriguing aspect of the new imagery is the continuous and truly “knife-edge” character of the fault for the entire length of the 400-kilometer (250 mile) survey area.
Each time the Queen Charlotte-Fairweather fault ruptures in a large-magnitude earthquake, the seascape on either side moves horizontally. Where the fault slices through submarine canyons, ridges, and slopes, the cumulative movement over several thousand years leads to a mismatch of those features. The offset landforms, or “piercing points,” are important indicators that we can use to calculate the average rate of fault motion and the typical recurrence interval for large earthquakes.
Other interesting features we observed include broad glacial troughs, moraines, and channels near the edge of the continental shelf, which probably deliver a tremendous volume of sediment to the continental slope. We also mapped hundreds of small underwater landslides as well as several larger slides. The team will evaluate the potential links between earthquakes, glacial sediment supply, and underwater landslides along the continental margin. This is an important task since earthquake-triggered landslides can generate dangerous tsunamis in southeast Alaska communities. For example, an earthquake-triggered rockfall in 1958 produced a deadly tsunami in Lituya Bay.
Second cruise: two weeks of nearly ideal weather
During the handful of summer weeks we had back in the office between cruises, we pushed hard to process and interpret the data collected on the R/V Medeia. We needed the results to plan for the second expedition aboard the privately owned R/V Norseman (USGS Survey 2016-656-FA). Scientists from the USGS Pacific Coastal and Marine Science Center (Danny Brothers, Amy East, Jackson Curie, Alicia Balster-Gee, and Daniel Ebuna, a University of California, Santa Cruz student contractor), and the USGS Woods Hole Coastal and Marine Science Center (Nathan Miller and Eric Moore) arrived in Seward on August 6 to set up equipment.

The cruise began on August 8 with a short trip to Resurrection Bay near Seward to test the 80-channel hydrophone streamer and sparker sound source. After equipment testing and an unscheduled rescue operation (see bottom of page), we crossed the Gulf of Alaska for a two-week survey of the Queen Charlotte-Fairweather fault.
Early results look promising
We began at the south end of the study area near Noyes Canyon and worked our way northward. The team spent three days mapping fault-bounded basins offshore of Chatham Strait, near Sitka and the Mount Edgecumbe volcano, and the Yakobi Sea Valley. We endured a few days of 3-meter (10 foot) seas but otherwise had ideal weather and collected about 2,100 kilometers (1,300 miles) of seismic-reflection profiles.
Continuing the journey
Our inveterate team of explorers will use the 2015 and 2016 data to guide fieldwork in 2017, including multibeam mapping and seismic-reflection surveying in other areas of the fault zone. Collaborating with the Geological Survey of Canada and the Sitka Sound Science Center, we plan to use the mapping and seismic data to guide selection of sites for sediment coring. Back in the lab, we will use radiocarbon dating of core samples to measure sediment ages.

These sediment ages enable us to date fault activity during the past 10,000 years—the Holocene epoch. The ages also will help us understand links between long-term (1,000 year) fault movement and motions observed during major historical earthquakes.
The radiocarbon dates could help us establish when glaciers melted back from the edge of the continental shelf. In the late Pleistocene, more than 10,000 years ago, sea level was lower and Alaskan glaciers were much longer, extending across areas of the continental shelf that are now submerged. Some researchers think that humans migrated from Asia to North America along an ice-free coast before using an inland route. Knowing how long ago those glaciers retreated could determine when that coastal migration might have started.
Exciting discoveries continue to roll in with each field effort along the Queen Charlotte-Fairweather fault. We look forward to continuing the journey toward better understanding of the geologic, geohazard, and even ethnographic history of this continental margin.
Rescue of Three Stranded Boaters Opens August Research Cruise

By Helen Gibbons and Danny Brothers
Scientists from the USGS were testing equipment in Resurrection Bay, Alaska, on August 8, 2016, when their research vessel received a distress signal from a small boat about 3 miles away. The privately-owned R/V Norseman steamed to the location and found three people stranded on a rocky beach after their skiff capsized in the surf. Two smaller vessels had attempted a rescue before the Norseman arrived, but large swells breaking off the beach nearly capsized them as well. The water was frigid, and so three Norseman crewmembers tossed survival suits into a rubber raft, lowered it into the water, and headed toward the beach.
Rather than motoring through the breaking waves and tricky currents, one of the crewmembers swam ashore. Wearing his own survival suit, he towed three more, plus a rope attached to the raft. The rescuer helped the stranded people suit themselves up, and one by one the crewmembers pulled the boaters through the surf and onto the raft. The operation took about an hour.

“The guys working on the raft and in the water were exhausted when they made it back to the ship,” said Danny Brothers, a USGS geophysicist and lead scientist on the expedition. “Those survival suits aren’t exactly designed for strenuous exercise.”
Crewmembers welcomed the boaters aboard the Norseman, wrapped them in blankets, and gave them hot coffee. The ship dropped the rescued party off in Seward, then departed on time for a two-week expedition to map the Queen Charlotte-Fairweather fault off southeast Alaska.
“The survey was very successful, despite a few days of rough seas,” said Brothers. “I think the rescue gave us good karma.”
Related Content

Coastal and Marine Geohazards of the U.S. West Coast and Alaska

Earthquake Hazards in Southeastern Alaska
Related Content
Coastal and Marine Geohazards of the U.S. West Coast and Alaska
Earthquake Hazards in Southeastern Alaska
Get Our News
These items are in the RSS feed format (Really Simple Syndication) based on categories such as topics, locations, and more. You can install and RSS reader browser extension, software, or use a third-party service to receive immediate news updates depending on the feed that you have added. If you click the feed links below, they may look strange because they are simply XML code. An RSS reader can easily read this code and push out a notification to you when something new is posted to our site.