
A storm moved north along the Atlantic Coast spreading rain across the State, from March 12 through March 15, 2010. Light rain began to fall during late morning on Friday March 12. Steady, heavier rain developed on Saturday morning and continued through the evening. Bands of heavy rain and scattered thunderstorms occurred on Sunday with showers continuing through Monday March 15, 2010.
Precipitation

A storm moved north along the Atlantic Coast spreading rain across the State, from March 12 through March 15, 2010. Light rain began to fall during late morning on Friday March 12. Steady, heavier rain developed on Saturday morning and continued through the evening. Bands of heavy rain and scattered thunderstorms occurred on Sunday with showers continuing through Monday March 15, 2010. Rainfall amounts were greatest in central and northeastern New Jersey.
A National Weather Service map of total observed precipitation for the 7-day period ending March 16, 2010, at 1900 hours EDT (fig. 1) showed areas of 6 to 8 inches in parts of Bergen, Middlesex, Morris, Somerset, and Union Counties. The southwestern and western parts of the State received the least precipitation, with totals generally ranging from 2.5 to 4 inches. The rest of the State received 4 to 6 inches of rain.
Precipitation gages operated by the U.S. Geological Survey (USGS) and the National Weather Service (NWS) recorded total precipitation amounts ranging from 2.3 inches (data from a NWS observer at Knowlton in Warren County) to 7.5 inches at the USGS precipitation gage at Mountainside in Union County (404059074223301). Gages at NWS climate sites at Newark, Trenton, and Atlantic City recorded 5.2 inches, 2.6 inches and 3.8 inches respectively. USGS gages recorded from 3.9 to 7.5 inches in the Raritan and Rahway River Basins, 3.5 to 4.3 inches in the Passaic and Hackensack River Basins, 3.6 to 4.4 inches in the Lower Delaware River Basin, 2.5 to 4.0 inches in the Upper Delaware Basin and 3.2 to 5.9 inches in the southern Atlantic Coastal Plain Basins.
Antecedent Conditions

Precipitation was higher than normal in February and in the 12 months leading up to March 2010. Precipitation recorded at the NWS Atlantic City gage during the preceding 12 months was 67 inches, which is 27 inches above normal. Precipitation across New Jersey in February was two to three times the normal amount (U.S. Geological Survey, 2010). Much of the precipitation that fell in February was snow. This February, with 36.6 inches of snow, was the second wettest and the snowiest February on record for Atlantic City dating back to 1906. Snowmelt contributed to increasing streamflows at many stream gages in the northern part of the State for a period of 10 days to 2 weeks before this storm. No precipitation was observed during that period.
After the last snow storm on February 25-26, 2010, the entire State had substantial snow cover from multiple snowstorms in February (fig. 2). Snow cover in the northwestern part of the State was equivalent to 6 to 8 inches of water and there was generally 2 to 4 inches of water equivalent on the ground as snow in central and southern New Jersey. By March 12, 2010, all of the snow had melted, except in small areas in northwestern New Jersey (fig. 3).

Peak Flows at Continuous-Record Streamflow Gaging Stations
Flood peaks were the highest ever recorded at three USGS continuous-record streamflow gaging stations in the Mullica, Passaic, and Toms River Basins (fig. 4). The Toms River near Toms River, NJ (01408500), station recorded the highest flood peak in 81 years of record (fig. 5). The Passaic River at Pine Brook, NJ (01381900) station recorded the highest flood peak in 48 years of record. The West Branch Wading River near Jenkins, NJ (01409810), station recorded the highest flood peak in 25 years of record. Flood peaks for this event and historical peaks of record for these streamgages and others across the State are listed in table (below).
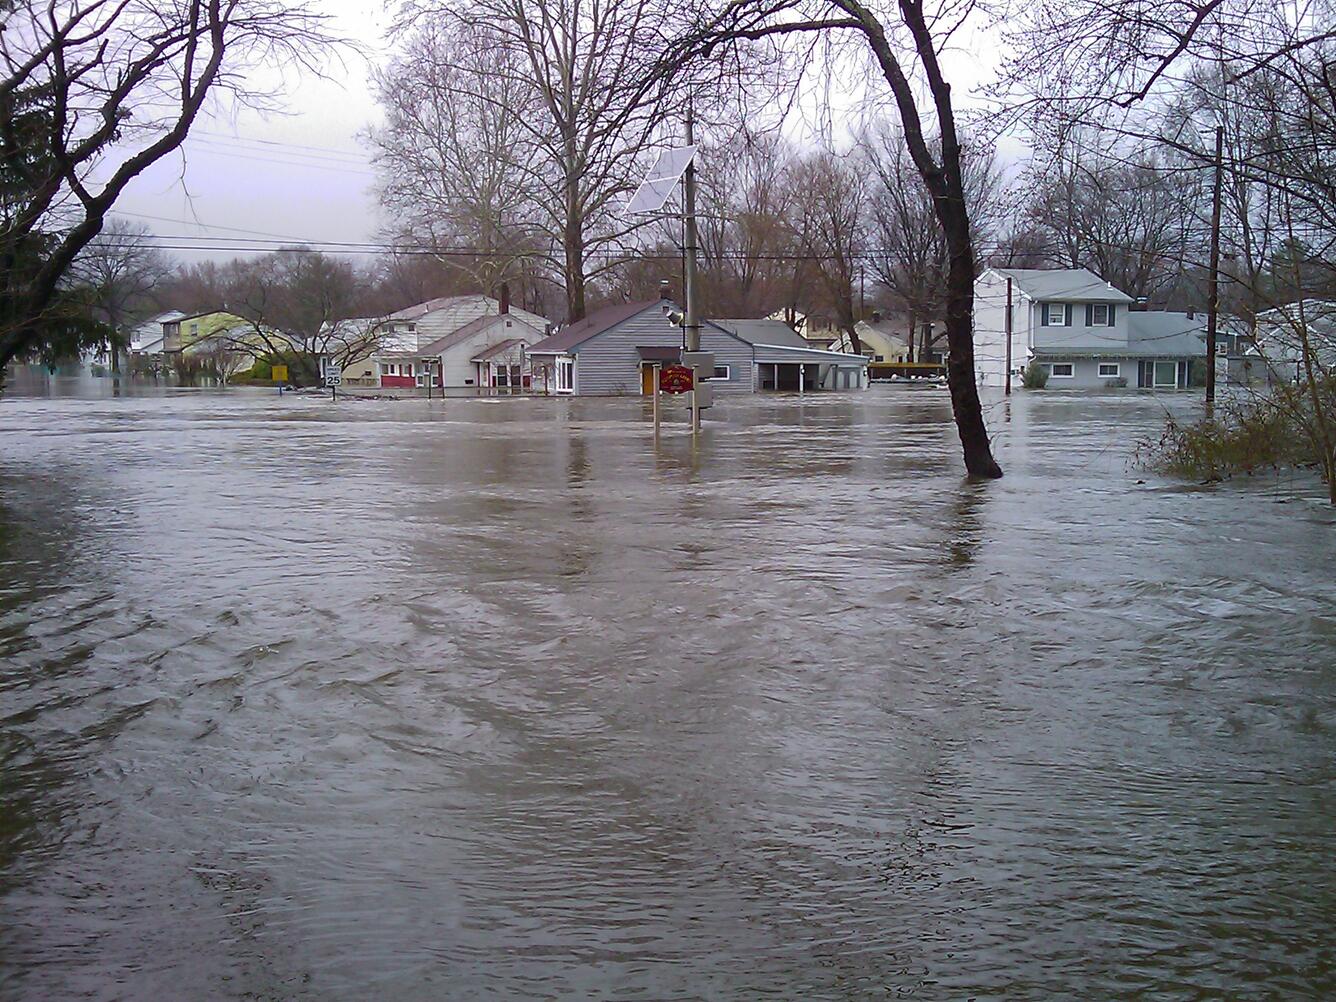
The second highest flood peak of record was recorded at eight streamgages in the Passaic, Raritan, Hackensack, Maurice, and Delaware River Basins. Gaging stations on Green Pond Brook and Whippany River in the Passaic River Basin, Bound Brook and Deep Run in the Raritan River Basin, Little Ease Run in the Maurice River Basin, East Branch Paulins Kill in the upper Delaware River Basin and Hackensack River at Rivervale experienced the second highest peaks of record. The third highest peaks of record were recorded at four streamgages in the Passaic River Basin and four streamgages on streams in the southern New Jersey Coastal Plain. Many residential and commercial properties along the Pompton and Ramapo Rivers in the Passaic River Basin flooded (fig. 6). The streamgage at Pequannock River at Macopin Intake Dam (01389500) recorded the third highest flood peak in 96 years of recorded peak data. The flood peak in the early morning hours of March 14 was accentuated by the breach of a large beaver dam upstream, reported to USGS by the City of Newark. The flood peaks at 28 of the 108 active continuous-record streamgages with more than 5 years of record for this event rank in the top five recorded peaks of record.

Flood frequencies observed during this flood ranged from a 60-year event (1.7 percent annual exceedance probability) on the Toms River near Toms River (01408500) to a less than 2-year event (> 50-percent annual exceedance probability) on the main stem of the Delaware River. The Ramapo River at Mahwah (01387500) and Pompton River at Pompton Plains (01388500) each experienced 40-year events (2.5-percent annual exceedance probability), the fifth highest peak in 94 years and the third highest peak in 69 years, respectively. The Great Egg Harbor River at Folsom (01411000) also had a 40-year event, the third highest peak in 84 years. In the Passaic River Basin, the Passaic River streamgages along the main stem experienced from 20-year to 30-year events (3 to 5 percent annual exceedance probability), as did the Rockaway River, Green Pond Brook, Ringwood Creek, and Wanaque River tributaries.
Streamgages at the downstream end of the North Branch Raritan River and the main stem of the Raritan River had peak flows in the range of 20-year to 30-year events. All gages on the South Branch Raritan River and other gages in the North Branch Raritan River draining 65 or fewer square miles had floods with less than 10-year recurrence-intervals. The Millstone River at Blackwells Mills (01402000), Bound Brook at Middlesex (01403900), and Manalapan Brook at Spotswood (01405400) had 20-year events (5-percent annual exceedance probability).
Tributaries to the Delaware River experienced floods with 3- to 14-year recurrence-interval floods (33- to 7-percent annual exceedance probabilities, respectively). The flood frequencies referenced in this flood summary are from Watson and Schopp, (2009).
Peak Stage at Continuous-Record Tide Gages

Peak stage during high tide on Saturday evening, March 13, 2010, was the highest for the period of record at eight USGS continuous-record tide-telemetry stations. The eight gages with new record high peaks were Raritan River at South Amboy (01406710) (fig. 7), Passaic River at PVSC at Newark (01392650), Raritan Bay at Keansburg (01407081), Shrewsbury River at Sea Bright (01407600), Shark River at Belmar (01407770), Manasquan River at Point Pleasant (01408050), Barnegat Bay at Waretown (01409110), and Barnegat Bay at Barnegat Light (01409125). The datum of these gages is North American Vertical Datum of 1988.
The gage at Raritan River at South Amboy recorded a peak stage of 8.04 feet, 2.37 feet higher than the previous peak of record on April 16, 2007 (fig. 6). The gage at Raritan Bay at Keansburg recorded a peak stage of 7.01 feet, 1.55 feet higher than the previous peak of record on December 25, 2002. The gage at Passaic River at PVSC at Newark recorded a peak stage of 6.47 feet, 0.93 foot higher than the previous peak of record on April 16, 2007. The gage at Shrewsbury River at Sea Bright recorded a peak stage of 5.33 feet, 0.58 foot higher than the previous peak of record on April 16, 2007. The gage at Shark River at Belmar recorded a peak stage of 5.59 feet, 0.43 foot higher than the previous peak of record on February 12, 2006. The gage at Manasquan River at Point Pleasant recorded a peak stage of 4.87 feet, 0.46 foot higher than the previous peak of record on January 31, 2006. The gage at Barnegat Bay at Waretown recorded a peak stage of 2.93 feet, 0.03 foot higher than the previous peak of record on October 25, 2005. The gage at Barnegat Bay at Barnegat Light recorded a peak stage of 3.78 feet, 0.10 foot higher than the previous peak of record on October 25, 2005.
Response to the Event

The USGS New Jersey Water Science Center’s Hydrologic Data Assessment Program prepared for field work in response to the forecasted flood conditions before high water occurred. Real-time data from USGS gaging stations across New Jersey were invaluable in planning the first line of response to the storm. The real-time data helped USGS personnel focus efforts on the watersheds experiencing the most flooding. At 6 AM on Saturday morning, three crews were dispatched to a few selected gages to make discharge measurements. Two crews also made discharge measurements and collected water quality samples on tributaries to Barnegat Bay for a nutrient-loading study on the rising limb of the hydrograph. On Sunday, March 14, and Monday March 15, five crews made discharge measurements, inspected gages, and flagged high-water marks at gages across New Jersey.
Fifty-seven discharge measurements were made from March 13th through March 16th. Discharge measurements were the highest ever made at long-term gages at Toms River near Toms River, Passaic River at Pine Brook, West Branch Wading River near Jenkins and Pompton River at Pompton Plains. Discharge measurements were also the highest ever made some relatively new gages. Discharge measurements were made on March 16th at or near the flood peak at gaging stations draining larger basins whose stream were slower to crest. Discharge measurements at some of these gages were made on the receding limb of the hydrograph on March 17th. Photographs of the flooded areas were taken at some gaging stations.
The USGS New Jersey Water Science Center stayed in communication with the Army Corps of Engineers, New York District and the NWS Mount Holly office during this event. Requests were answered for peak-stage and flow data from several gages, a comparison of peaks from this storm with historic peaks, and the flood frequency of the event at various locations. The New Jersey Water Science Center participated in a conference call with the USGS National Flood Specialist and personnel at other Water Science Centers about flooding across the country. The Federal Emergency Management Agency (FEMA) was contacted to offer our assistance with flood related work..
The N.J. Department of Environmental Protection Bureau of Dam Safety, reported breaches in two dams as a result of this storm. Shawnee Lake on Weldon Brook, a tributary to Lake Hopatcong, was confirmed to have a partial failure when 30 feet of the dam’s berm eroded on the evening of March 13th. Although the USGS stage-only gage on Lake Hopatcong and the continuous-record streamflow gaging station on Musconetcong River at the outlet of Lake Hopatcong are downstream from this dam, the increase in flow downstream from the dam as a result of the partial dam failure is not evident in the records from either site. The Bureau also reported a breach 8 feet long in the berm of the dam on Lake Tamarack in the headwaters of Franklin Pond Brook, a tributary to the Wallkill River in Hardystown Township, Sussex County.
External Citiations
National Weather Service, 2009, National Weather Service --Advanced hydrologic prediction service: Accessed March 16, 2010 at http://water.weather.gov/ .
National Weather Service, 2010, National Operational Hydrologic Remote Sensing Center – Interactive snow information: Accessed March 13, 2010 at http://www.nohrsc.nws.gov/interactive/html/map.html .
Summary of flood peaks from March 12-15, 2010
table pdf available upon request
Get Our News
These items are in the RSS feed format (Really Simple Syndication) based on categories such as topics, locations, and more. You can install and RSS reader browser extension, software, or use a third-party service to receive immediate news updates depending on the feed that you have added. If you click the feed links below, they may look strange because they are simply XML code. An RSS reader can easily read this code and push out a notification to you when something new is posted to our site.