
This flood event viewer map, dated Oct. 3, 2018, shows the extent and type of information collected by USGS hydrologists in North and South Carolina in the wake of historic flooding brought on by Hurricane Florence.
Images
SAWSC Images
Filter Total Items: 102

USGS science on a map of the Carolinas after Hurricane Florence
This flood event viewer map, dated Oct. 3, 2018, shows the extent and type of information collected by USGS hydrologists in North and South Carolina in the wake of historic flooding brought on by Hurricane Florence.

Double-checking a high water mark on a church door near Maxton, NC
USGS hydrographer Daniel McCay uses a level to double-check a high water mark on a church door near Maxton, NC as his USGS colleague Mary Winsor observes on Sept. 25, 2018, in the wake of flooding brought on by Hurricane Florence.
USGS hydrographer Daniel McCay uses a level to double-check a high water mark on a church door near Maxton, NC as his USGS colleague Mary Winsor observes on Sept. 25, 2018, in the wake of flooding brought on by Hurricane Florence.

A high water mark above the eaves of a Spring Hill, NC house
USGS hydrologic technician Rob Forde flags a high water mark above the eaves at Presbyterian Church of the Covenant, 118 Manchester Road, Spring Hill, North Carolina on Sept. 21, 2018, in the wake of flooding brought on by Hurricane Florence.
USGS hydrologic technician Rob Forde flags a high water mark above the eaves at Presbyterian Church of the Covenant, 118 Manchester Road, Spring Hill, North Carolina on Sept. 21, 2018, in the wake of flooding brought on by Hurricane Florence.

Measuring a high water mark as flooding recedes
USGS hydrographer Kyle Marchman measures a high water mark on the rear wall of a Kangaroo gas station on Highway 24 north of Fayetteville, NC on Sept. 18, 2018, after flooding caused by Hurricane Florence.
USGS hydrographer Kyle Marchman measures a high water mark on the rear wall of a Kangaroo gas station on Highway 24 north of Fayetteville, NC on Sept. 18, 2018, after flooding caused by Hurricane Florence.

Measuring the Lumber River floodwaters
James Stonecypher measures flood waters from the Lumber River that breached a dam in Lumberton, North Carolina after the passage of Hurricane Florence, Sept. 17, 2018.
James Stonecypher measures flood waters from the Lumber River that breached a dam in Lumberton, North Carolina after the passage of Hurricane Florence, Sept. 17, 2018.
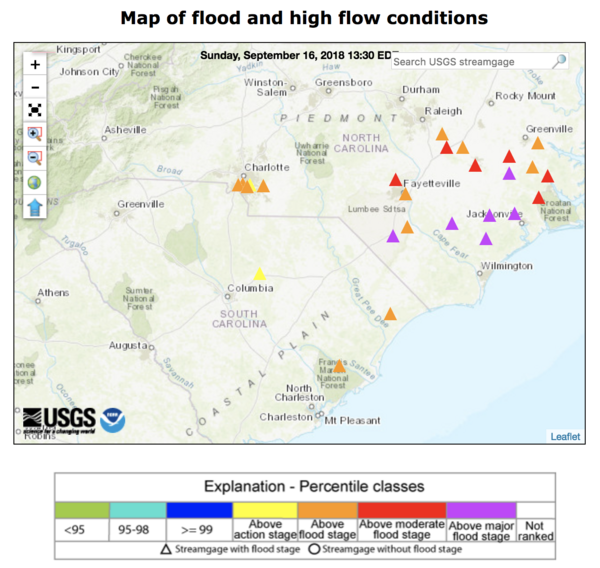
As Florence rains, rivers keep rising, submerging some USGS instrument
A WaterWatch web map shows streamgages in North and South Carolina that approached or exceeded major flood stage EST on September 19, 2018, as the former Hurricane Florence, now downgraded to a tropical depression, deluged the states with rain.
A WaterWatch web map shows streamgages in North and South Carolina that approached or exceeded major flood stage EST on September 19, 2018, as the former Hurricane Florence, now downgraded to a tropical depression, deluged the states with rain.

Working to keep vital flood information flowing in the Carolinas
David Stillwell, USGS hydrologic technician, performs a discharge measurement to help document and forecast flooding caused by Hurricane Florence at Long Creek in Rhyne, North Carolina on Sept. 16.
David Stillwell, USGS hydrologic technician, performs a discharge measurement to help document and forecast flooding caused by Hurricane Florence at Long Creek in Rhyne, North Carolina on Sept. 16.

USGS Scientists Get Ready for Hurricanes
A USGS hydrologic scientist installs a storm-tide sensor near the North Carolina coast as Hurricane Florence approaches.
A USGS hydrologic scientist installs a storm-tide sensor near the North Carolina coast as Hurricane Florence approaches.

USGS Storm-Tide Sensor for Hurricane Florence
A USGS storm-tide sensor, deployed in advance of Hurricane Florence's landfall. The sensors are housed in vented steel pipes a few inches wide and about a foot long. They are being installed on bridges, piers, and other structures that have a good chance of surviving the storm.
A USGS storm-tide sensor, deployed in advance of Hurricane Florence's landfall. The sensors are housed in vented steel pipes a few inches wide and about a foot long. They are being installed on bridges, piers, and other structures that have a good chance of surviving the storm.

Debris Pile on Interstate 95, Southbound Bridge, Pee Dee River, South Carolina
Debris Pile on Interstate 95, Southbound Bridge, Pee Dee River, South Carolina
Debris Pile on Interstate 95, Southbound Bridge, Pee Dee River, South Carolina

Levels - Brad Huffman
A leveling instrument being carried by Brad Huffman at a high water mark site in Florence, SC
A leveling instrument being carried by Brad Huffman at a high water mark site in Florence, SC

Ocoee River, Tennessee
Ocoee River, Tennessee

Before and after pictures - Hurricane Rita and Holly Beach, Louisiana
Hurricanes can cause severe beach erosion
——————————————————————
Hurricanes can cause severe beach erosion
——————————————————————

Acoustic Doppler Current Profiler (ADCP) to measure streamflow
The use of acoustic Doppler current profilers (ADCPs) from a moving boat is now a commonly used method for measuring streamflow. The technology and methods for making ADCP-based discharge measurements are different from the technology and methods used to make traditional discharge measurements with mechanical meters.
The use of acoustic Doppler current profilers (ADCPs) from a moving boat is now a commonly used method for measuring streamflow. The technology and methods for making ADCP-based discharge measurements are different from the technology and methods used to make traditional discharge measurements with mechanical meters.

Jessica Cain and Ryan Rasmussen, Hydrologic Technicians, 2016.
Jessica Cain and Ryan Rasmussen, Hydrologic Technicians, measure water quality at Jordan Lake, 2016.
Jessica Cain and Ryan Rasmussen, Hydrologic Technicians, measure water quality at Jordan Lake, 2016.

USGS Scientists Mark a High-Water Mark in Louisiana
Daniel McCay and Chris Henry, USGS hydrologic technicians, use a level to draw a line on a high-water mark August 26. In most circumstances, when a high-water mark is flagged it would then be surveyed with GPS equipment to obtain its exact coordinates and elevation.
Daniel McCay and Chris Henry, USGS hydrologic technicians, use a level to draw a line on a high-water mark August 26. In most circumstances, when a high-water mark is flagged it would then be surveyed with GPS equipment to obtain its exact coordinates and elevation.

Looking for High-Water Marks
Daniel McCay and Chris Henry, U.S. Geological Survey hydrologic technicians, search a neighborhood south of Denham Springs, Louisiana, for high-water marks August 26. The term high-water mark refers to the debris flood waters will leave on walls, buildings and trees.
Daniel McCay and Chris Henry, U.S. Geological Survey hydrologic technicians, search a neighborhood south of Denham Springs, Louisiana, for high-water marks August 26. The term high-water mark refers to the debris flood waters will leave on walls, buildings and trees.

Recording a High-Water Mark
Jonathan Gillip, USGS hydrologist, documents a high-water mark he flagged near a damage retirement community in Denham Springs, Louisiana, August 26. So far, USGS teams have flagged and surveyed more than 400 high-watermarks across southern Louisiana.
Jonathan Gillip, USGS hydrologist, documents a high-water mark he flagged near a damage retirement community in Denham Springs, Louisiana, August 26. So far, USGS teams have flagged and surveyed more than 400 high-watermarks across southern Louisiana.

Surveying a High-Water Mark
Chris Henry and Daniel McCay, USGS hydrologic technicians, use GPS equipment to survey a high-water mark outside of a flooded elementary school in Denham Springs, Louisiana, August 28. This school was located in one of the hardest hit flood areas and the blue line simulates how high the water was at its peak during this historic flood.
Chris Henry and Daniel McCay, USGS hydrologic technicians, use GPS equipment to survey a high-water mark outside of a flooded elementary school in Denham Springs, Louisiana, August 28. This school was located in one of the hardest hit flood areas and the blue line simulates how high the water was at its peak during this historic flood.

Droughts can affect groundwater levels and freshwater springs..
Comparison of water from an underground spring in Georgia during non-drought and drought periods.
Radium Springs, Albany, Georgia, USA
Comparison of water from an underground spring in Georgia during non-drought and drought periods.
Radium Springs, Albany, Georgia, USA

Ellerbe Creek, Durham, NC
Ellerbe Creek, Durham, NC
Ellerbe Creek, Durham, NC