
Scenic photo of Domes Beach in Rincon, Puerto Rico. Photo credit: Emily Himmelstoss.
Multimedia
Multimedia products produced by Woods Hole Coastal and Marine Science Center staff
Images

Puerto Rico beach
Scenic photo of Domes Beach in Rincon, Puerto Rico. Photo credit: Emily Himmelstoss.

DSAS v6.0 Infographic
The Digital Shoreline Analysis System (DSAS) version 6 is a standalone application that calculates shoreline or boundary change over time. The GIS of a user’s choice is used to prepare the data for DSAS. Like previous versions, DSAS v.6 enables a user to calculate rate-of-change statistics from multiple historical shoreline positions.
The Digital Shoreline Analysis System (DSAS) version 6 is a standalone application that calculates shoreline or boundary change over time. The GIS of a user’s choice is used to prepare the data for DSAS. Like previous versions, DSAS v.6 enables a user to calculate rate-of-change statistics from multiple historical shoreline positions.

DSAS
DSAS generates transects that are cast perpendicular to the reference baseline to intersect shorelines at a user-specified spacing alongshore. Please note that the figure above illustrates the placement of both onshore and offshore baselines as examples. In DSAS v6.0 all baselines in a file must be placed either offshore or onshore, not combined.
DSAS generates transects that are cast perpendicular to the reference baseline to intersect shorelines at a user-specified spacing alongshore. Please note that the figure above illustrates the placement of both onshore and offshore baselines as examples. In DSAS v6.0 all baselines in a file must be placed either offshore or onshore, not combined.

DSAS v6.0 Interface
The Digital Shoreline Analysis System (DSAS) version 6 is a standalone application that calculates shoreline or boundary change over time. The GIS of a user’s choice is used to prepare the data for DSAS. Like previous versions, DSAS v.6 enables a user to calculate rate-of-change statistics from multiple historical shoreline positions.
The Digital Shoreline Analysis System (DSAS) version 6 is a standalone application that calculates shoreline or boundary change over time. The GIS of a user’s choice is used to prepare the data for DSAS. Like previous versions, DSAS v.6 enables a user to calculate rate-of-change statistics from multiple historical shoreline positions.

DSAS v6.0 sample data
The Digital Shoreline Analysis System (DSAS) version 6 is a standalone application that calculates shoreline or boundary change over time. The GIS of a user’s choice is used to prepare the data for DSAS. Like previous versions, DSAS v.6 enables a user to calculate rate-of-change statistics from multiple historical shoreline positions.
The Digital Shoreline Analysis System (DSAS) version 6 is a standalone application that calculates shoreline or boundary change over time. The GIS of a user’s choice is used to prepare the data for DSAS. Like previous versions, DSAS v.6 enables a user to calculate rate-of-change statistics from multiple historical shoreline positions.

DSAS Software
The Digital Shoreline Analysis System (DSAS) version 6 is a standalone application that calculates shoreline or boundary change over time. The GIS of a user’s choice is used to prepare the data for DSAS. Like previous versions, DSAS v.6 enables a user to calculate rate-of-change statistics from multiple historical shoreline positions.
The Digital Shoreline Analysis System (DSAS) version 6 is a standalone application that calculates shoreline or boundary change over time. The GIS of a user’s choice is used to prepare the data for DSAS. Like previous versions, DSAS v.6 enables a user to calculate rate-of-change statistics from multiple historical shoreline positions.
Videos

The USGS Northeast Region: Delivering Science for Better Decisions
This video is an introduction of the USGS Northeast Region's science efforts to support society's evolving needs through its engaged and diverse workforce.
This video is an introduction of the USGS Northeast Region's science efforts to support society's evolving needs through its engaged and diverse workforce.

Introduction to the USGS Coastal Science Navigator
The Coastal Science Navigator is intended to help users discover USGS Coastal Change Hazards information, products, and tools relevant to their scientific or decision-making needs.
The Coastal Science Navigator is intended to help users discover USGS Coastal Change Hazards information, products, and tools relevant to their scientific or decision-making needs.

Flyover of the U.S. Coastline
Our Nation’s coastlines are almost 100,000 miles long. These extensive coastal areas stretch from Maine’s Atlantic shores in the northeast, south along the shores of the Gulf of Mexico and insular areas in the Caribbean.
Our Nation’s coastlines are almost 100,000 miles long. These extensive coastal areas stretch from Maine’s Atlantic shores in the northeast, south along the shores of the Gulf of Mexico and insular areas in the Caribbean.

Assateague Island National Seashore
sUAS coastal Imagery collected by the Woods Hole Coastal and Marine Science Center Aerial Imaging and Mapping group (AIM) at Assateague Island National Seashore October 10-14th, 2022.
sUAS coastal Imagery collected by the Woods Hole Coastal and Marine Science Center Aerial Imaging and Mapping group (AIM) at Assateague Island National Seashore October 10-14th, 2022.
Webcams

Pea Island video camera 1 snapshot
Two video cameras are temporarily mounted on a dune at Pea Island National Wildlife Refuge on the Outer Banks of North Carolina. The cameras are imaging the southern DUNEX (DUring Nearshore Event eXperiment) experiment site, and are designed to have a stereo view of the beach and potential overwash path until late October. Instruments from the U.S.
Two video cameras are temporarily mounted on a dune at Pea Island National Wildlife Refuge on the Outer Banks of North Carolina. The cameras are imaging the southern DUNEX (DUring Nearshore Event eXperiment) experiment site, and are designed to have a stereo view of the beach and potential overwash path until late October. Instruments from the U.S.

Pea Island video camera 2 snapshot
Two video cameras are temporarily mounted on a dune at Pea Island National Wildlife Refuge on the Outer Banks of North Carolina. The cameras are imaging the southern DUNEX (DUring Nearshore Event eXperiment) experiment site, and are designed to have a stereo view of the beach and potential overwash path until late October. Instruments from the U.S.
Two video cameras are temporarily mounted on a dune at Pea Island National Wildlife Refuge on the Outer Banks of North Carolina. The cameras are imaging the southern DUNEX (DUring Nearshore Event eXperiment) experiment site, and are designed to have a stereo view of the beach and potential overwash path until late October. Instruments from the U.S.
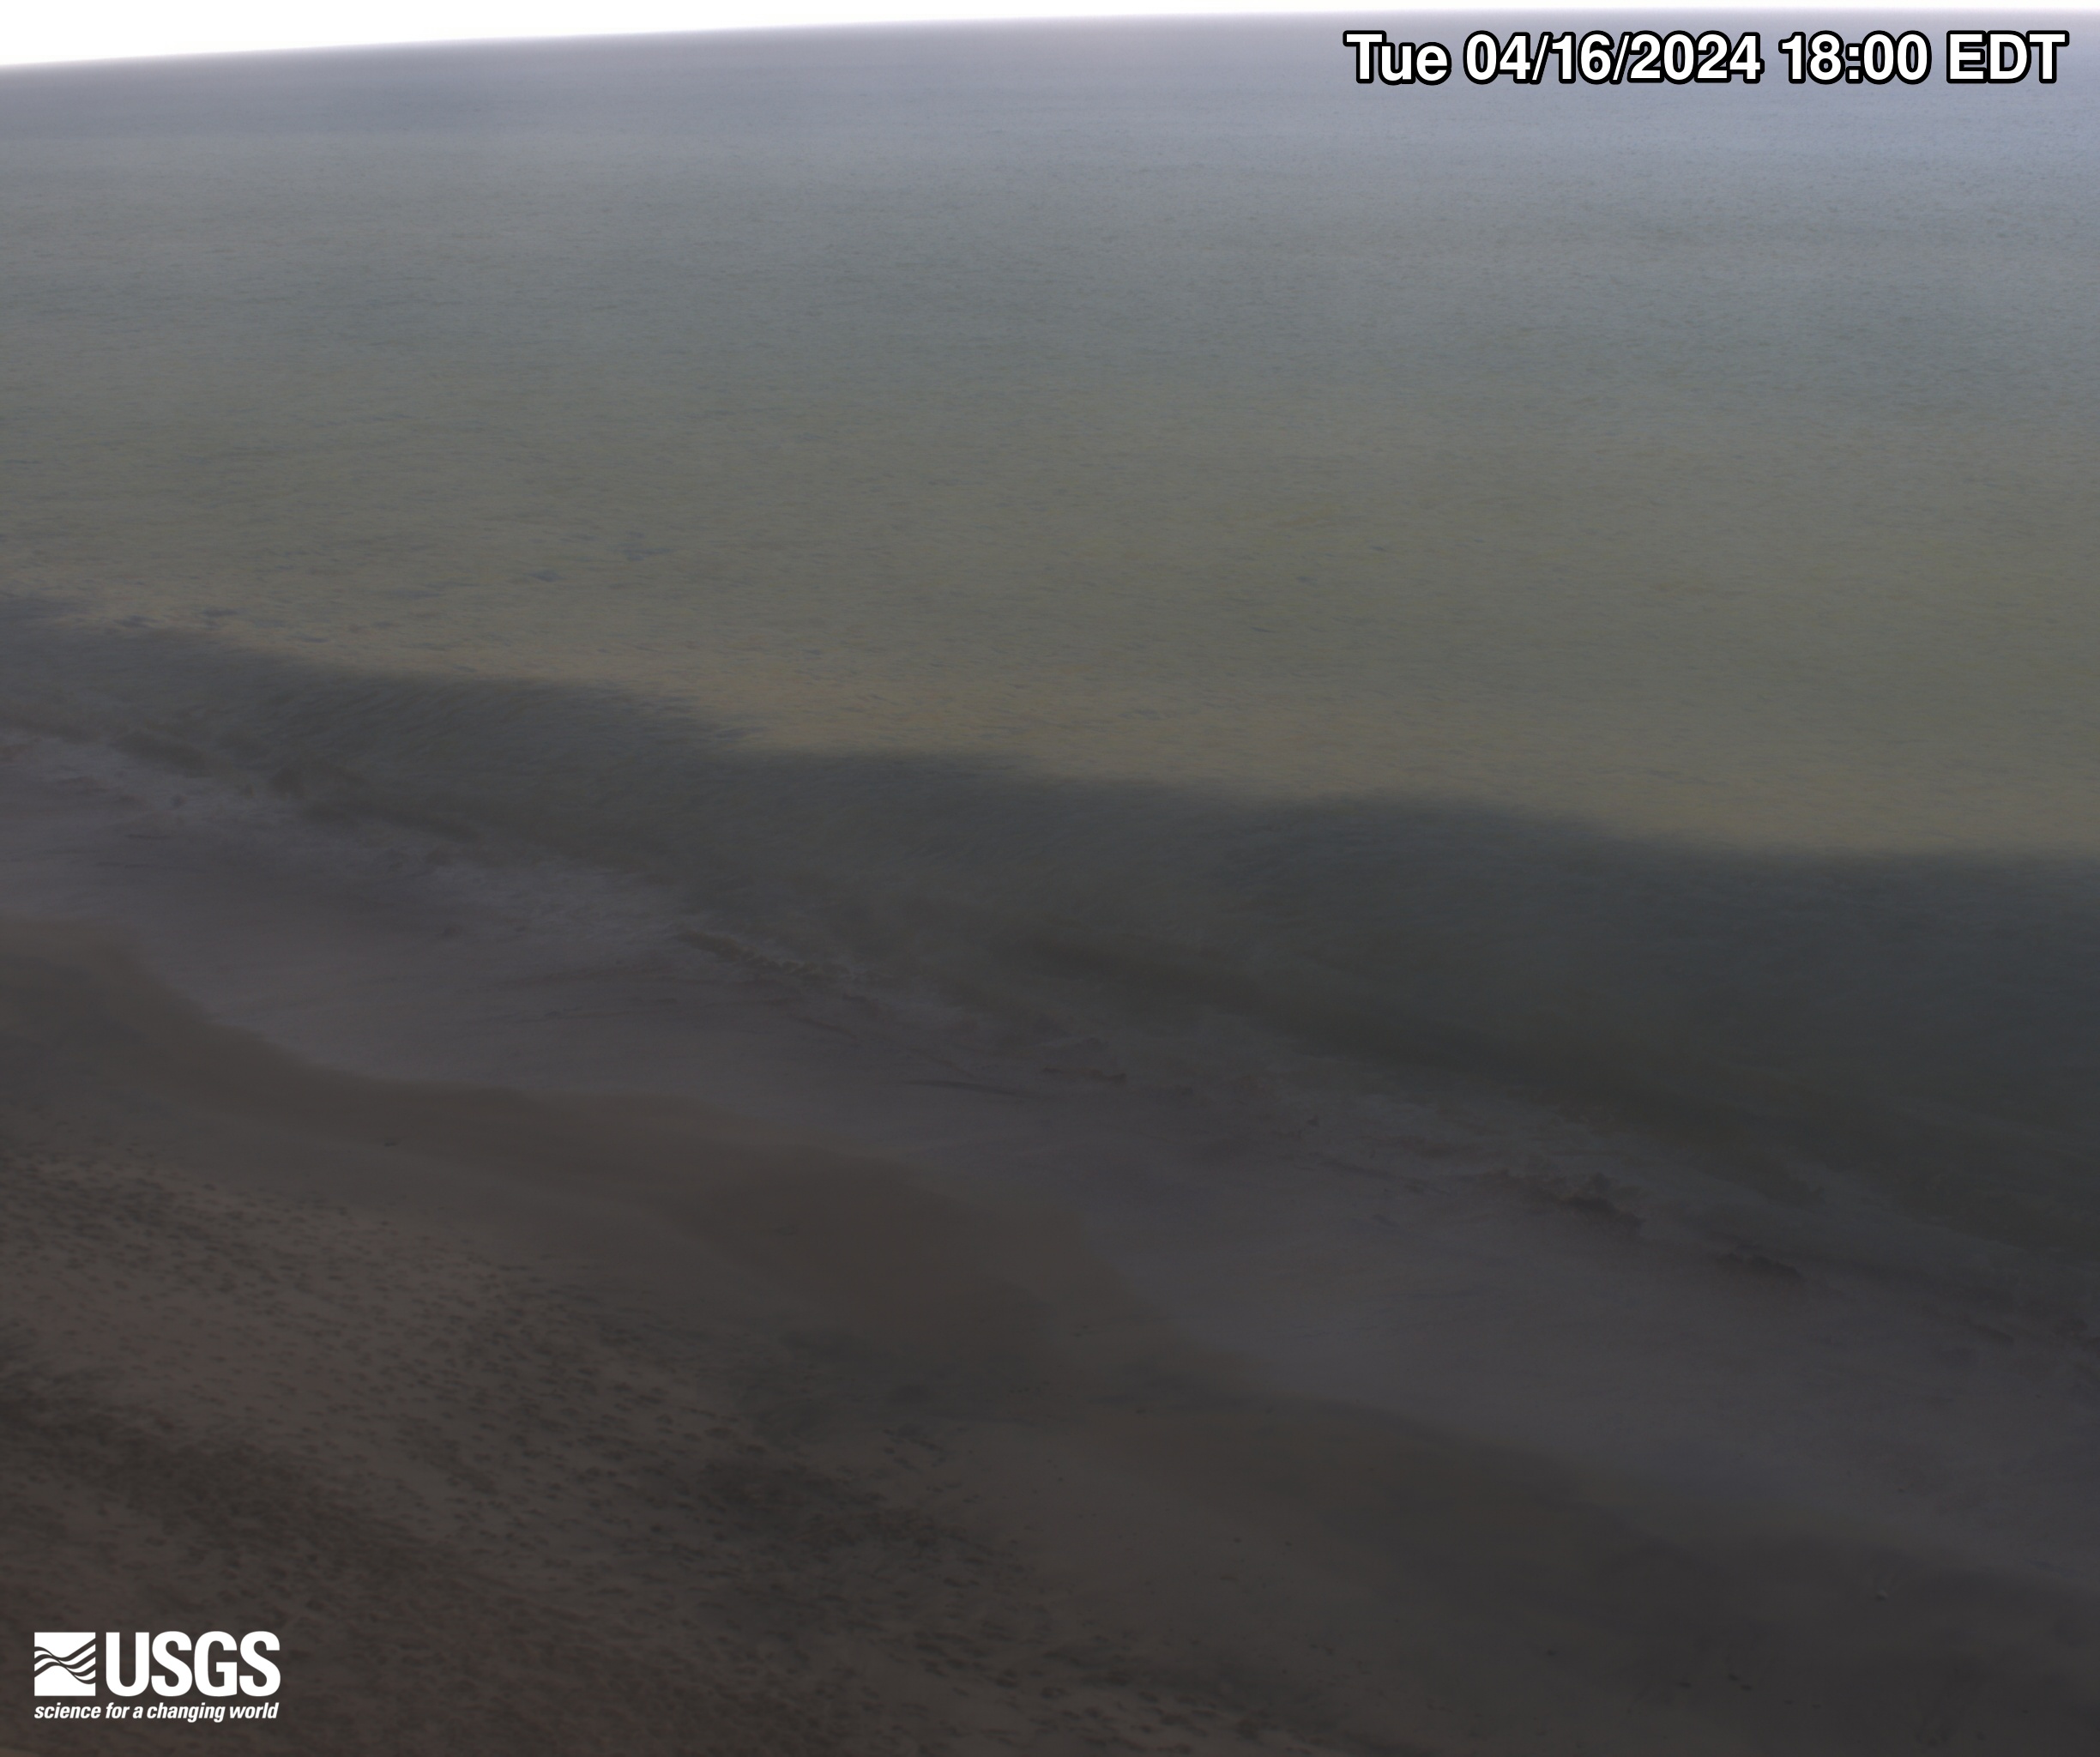
Marconi Beach video camera 1 dark image
Two video cameras are mounted on a bluff above Marconi Beach, Cape Cod National Seashore, Wellfleet, MA. Every half hour, the video cameras collect imagery for 10 minutes. This is the “dark” image, the darkest pixel values throughout the video, useful for tracking sediment plumes, tracking floating debris, and filtering out breaking waves.
Two video cameras are mounted on a bluff above Marconi Beach, Cape Cod National Seashore, Wellfleet, MA. Every half hour, the video cameras collect imagery for 10 minutes. This is the “dark” image, the darkest pixel values throughout the video, useful for tracking sediment plumes, tracking floating debris, and filtering out breaking waves.
Marconi Beach video camera 2 dark image
Two video cameras are mounted on a bluff above Marconi Beach, Cape Cod National Seashore, Wellfleet, MA. Every half hour, the video cameras collect imagery for 10 minutes. This is the “dark” image, the darkest pixel values throughout the video, useful for tracking sediment plumes, tracking floating debris, and filtering out breaking waves.
Two video cameras are mounted on a bluff above Marconi Beach, Cape Cod National Seashore, Wellfleet, MA. Every half hour, the video cameras collect imagery for 10 minutes. This is the “dark” image, the darkest pixel values throughout the video, useful for tracking sediment plumes, tracking floating debris, and filtering out breaking waves.

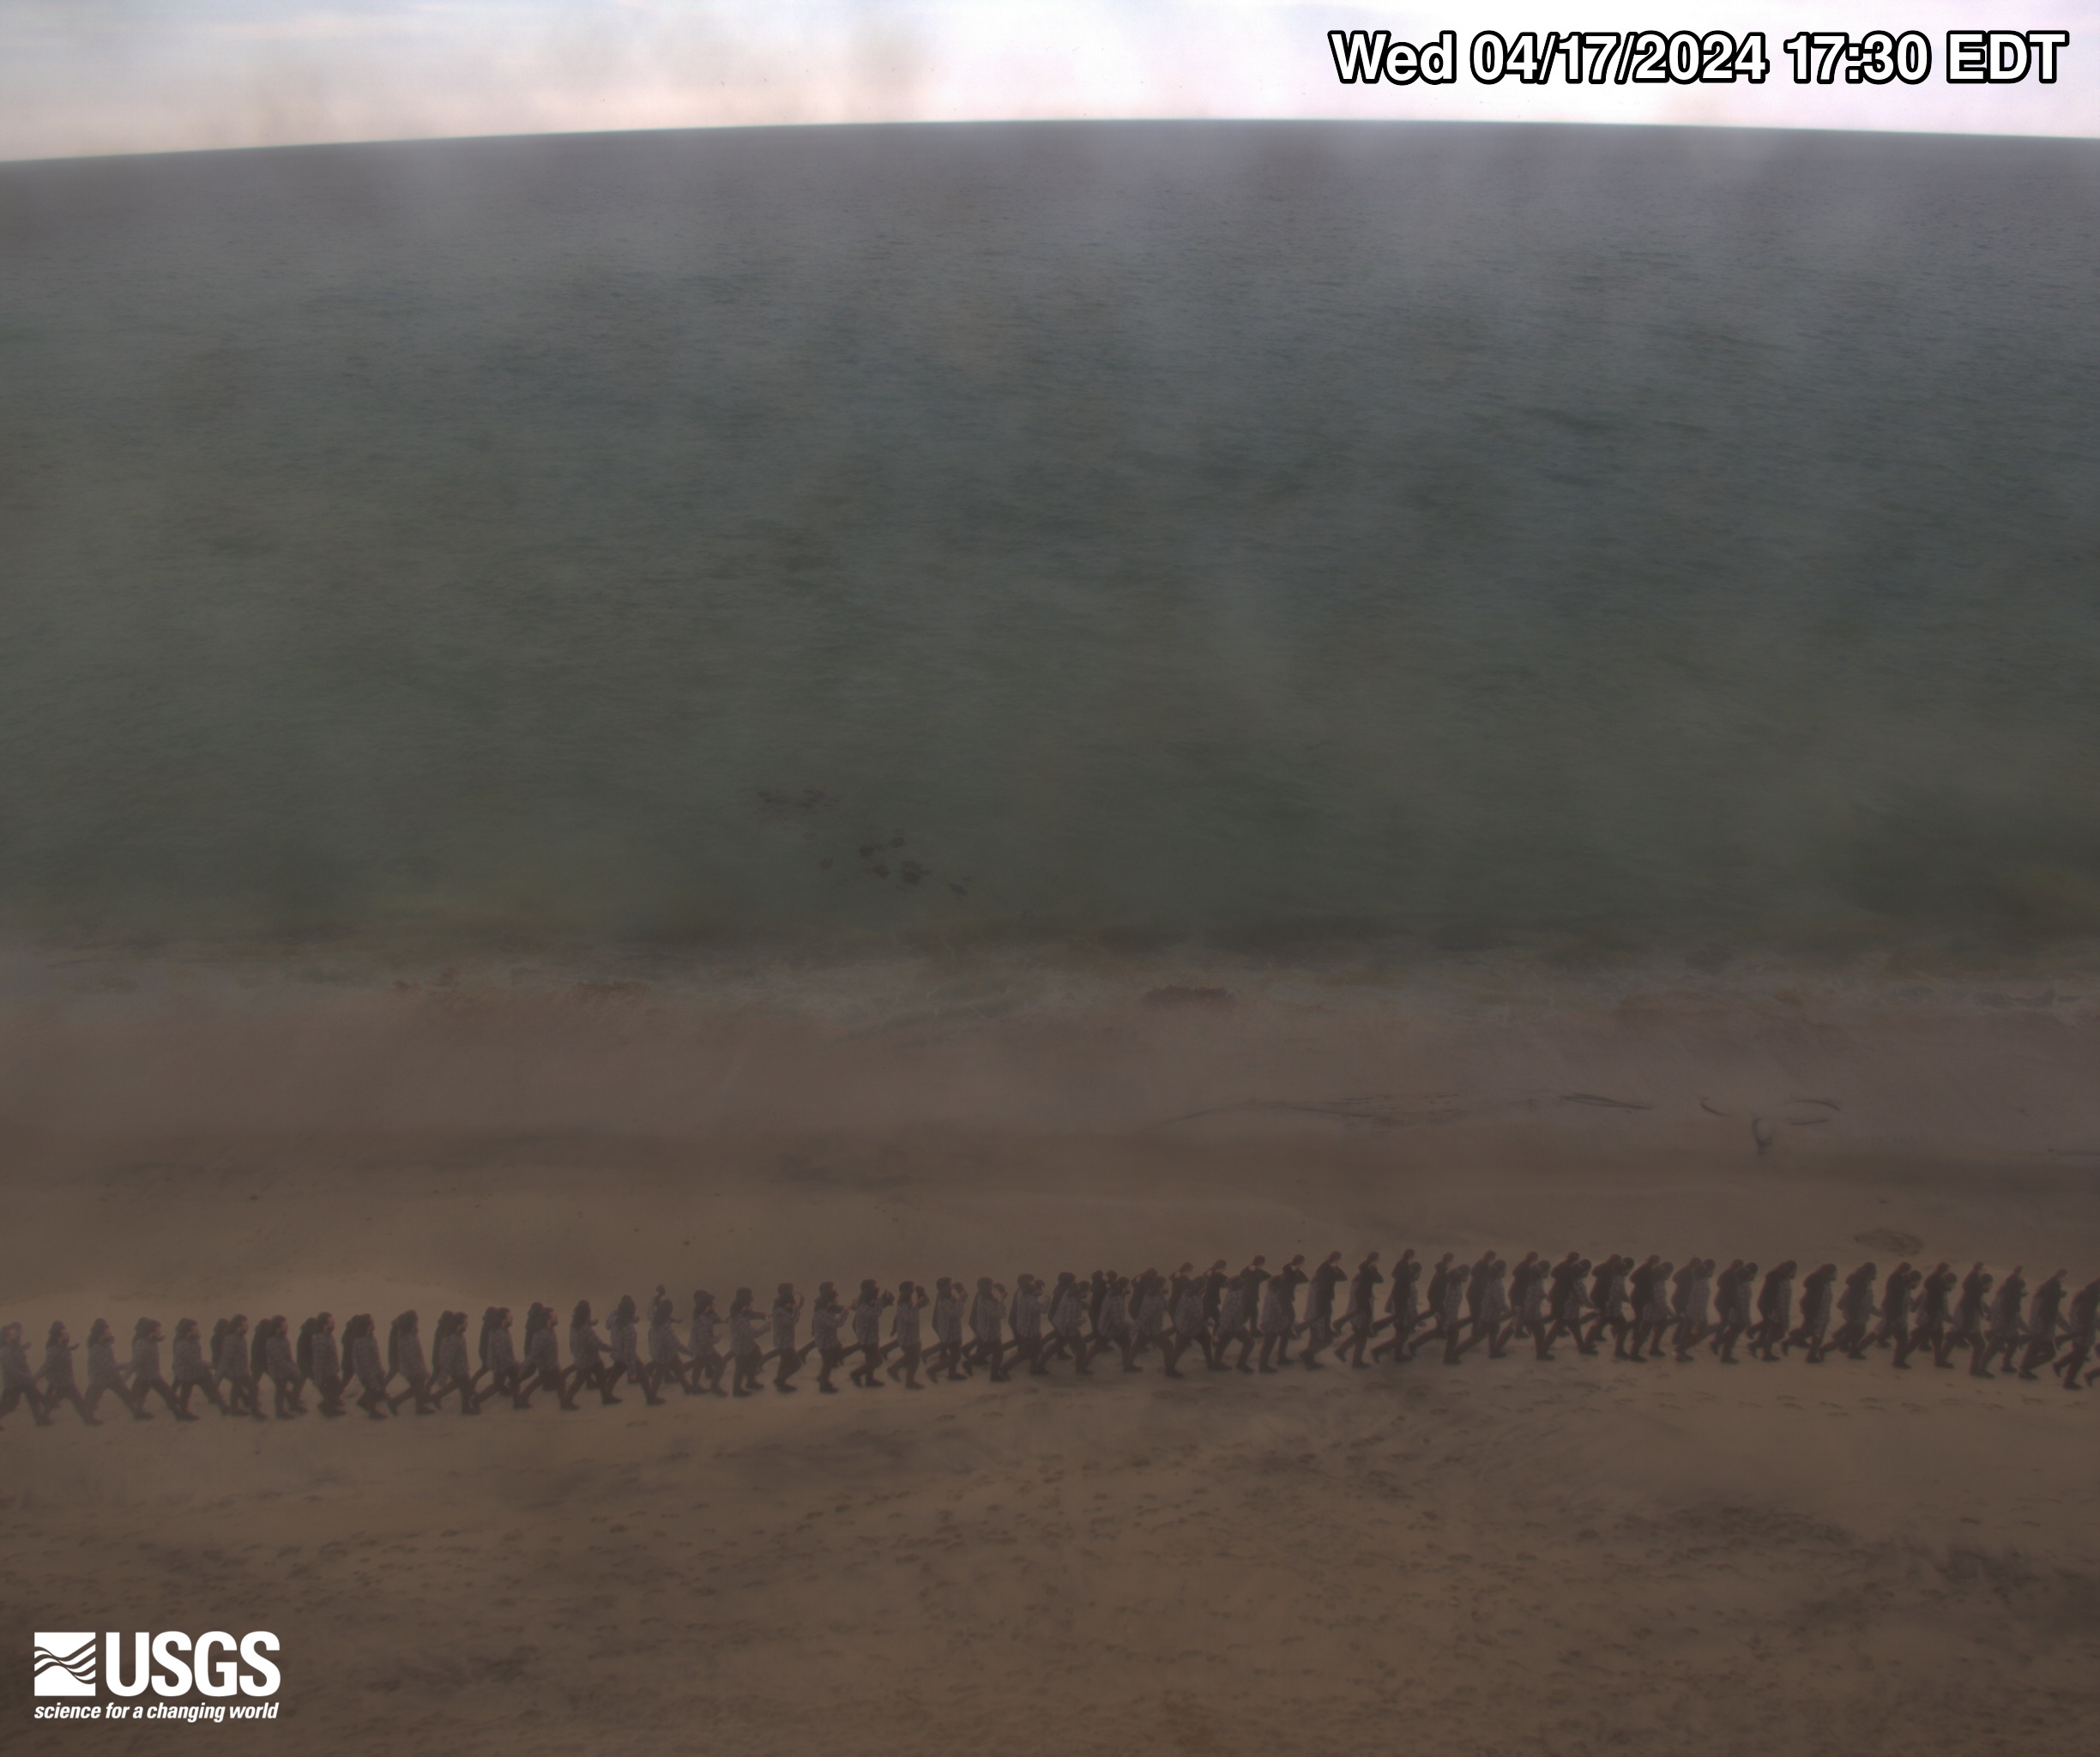
Marconi Beach video camera 1 variance image
Two video cameras are mounted on a bluff above Marconi Beach, Cape Cod National Seashore, Wellfleet, MA. Every half hour, the video cameras collect imagery for 10 minutes.
Two video cameras are mounted on a bluff above Marconi Beach, Cape Cod National Seashore, Wellfleet, MA. Every half hour, the video cameras collect imagery for 10 minutes.

Marconi Beach video camera 2 variance image
Two video cameras are mounted on a bluff above Marconi Beach, Cape Cod National Seashore, Wellfleet, MA. Every half hour, the video cameras collect imagery for 10 minutes.
Two video cameras are mounted on a bluff above Marconi Beach, Cape Cod National Seashore, Wellfleet, MA. Every half hour, the video cameras collect imagery for 10 minutes.