
Landsat 9 captured this natural color image of the ongoing fire in Uljin county on South Korea’s west coast.
Images
Explore USGS Landsat Program images.
Filter Total Items: 196

Fire near Uljin-eup, South Korea (Natural Color)
Landsat 9 captured this natural color image of the ongoing fire in Uljin county on South Korea’s west coast.

Fire near Uljin-eup, South Korea (False Color)
Landsat 9 captured an image of the ongoing fire in Uljin county on South Korea’s west coast. The false color image looks beneath the smoke and shows the burn scar as reddish-brown and the heat signature from the fire as bright red.
Landsat 9 captured an image of the ongoing fire in Uljin county on South Korea’s west coast. The false color image looks beneath the smoke and shows the burn scar as reddish-brown and the heat signature from the fire as bright red.
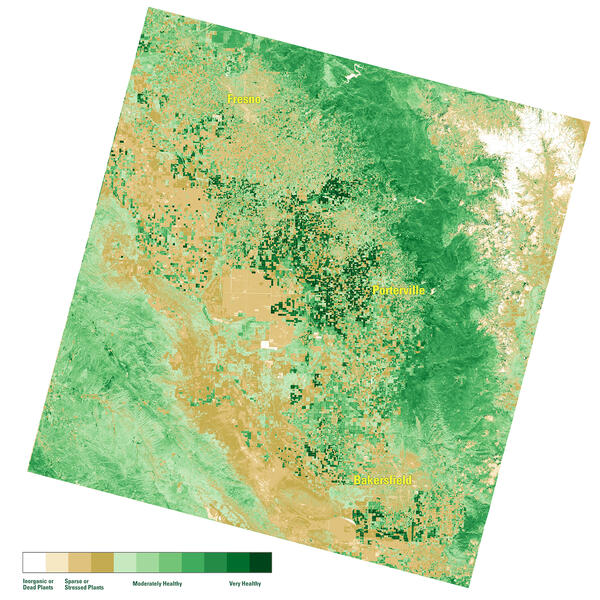
NDVI map of the San Joaquin Valley Region, March 10, 2022
A Landsat Surface Reflectance (SR) Normalized Difference Index (NDVI) map of the San Joaquin Valley region of California on March 10, 2022.
A Landsat Surface Reflectance (SR) Normalized Difference Index (NDVI) map of the San Joaquin Valley region of California on March 10, 2022.

Using Satellite-derived Maps in Rangeland Management
Rangeland management has used Landsat imagery for 50 years. Satellite imagery can provide a more comprehensive view of native pastures and prairies that cover swaths of Western America.
A new paper in Elsevier provides four guiding principles for ranges:
1. Use maps within a decision-making framework

Example of the Landsat 8-9 Collection 2 Provisional Aquatic Reflectance Science Product
These images from along the North Carolina coast show the Landsat 9 Level-1 product (natural color, Bands 4,3,2) from November 14, 2021 (left), and the corresponding Collection 2 Provisional Aquatic Reflectance product (Bands 4,3,1) for Landsat 9, Path 14 Row 35 (right).
These images from along the North Carolina coast show the Landsat 9 Level-1 product (natural color, Bands 4,3,2) from November 14, 2021 (left), and the corresponding Collection 2 Provisional Aquatic Reflectance product (Bands 4,3,1) for Landsat 9, Path 14 Row 35 (right).

Landsat 9 Underfly with Landsat 8 over Puerto Vallarta, Mexico
Images from the Landsat 9 underfly with Landsat 8 over Puerto Vallarta, Mexico on November 11, 2021. The left image shows the Landsat 8 OLI image and the right image is from Landsat 9 OLI. Both images are shown as a true color image using the red, green, and blue bands (Bands 4,3,2).
Images from the Landsat 9 underfly with Landsat 8 over Puerto Vallarta, Mexico on November 11, 2021. The left image shows the Landsat 8 OLI image and the right image is from Landsat 9 OLI. Both images are shown as a true color image using the red, green, and blue bands (Bands 4,3,2).

Landsat 9 Image of Ross Island
This Landsat 9 images shows Ross Island, off the coast of Antarctica. Ross Island is the home to the The U.S. Antarctic research station, McMurdo Station.
This Landsat 9 image was acquired on November 10, 2021.
This Landsat 9 images shows Ross Island, off the coast of Antarctica. Ross Island is the home to the The U.S. Antarctic research station, McMurdo Station.
This Landsat 9 image was acquired on November 10, 2021.

Landsat image of Window Rock, Arizona
Landsat image of Window Rock, Arizona, acquired on November 3, 2021.
For more information about Landsat, please visit www.usgs.gov/Landsat
To download the data, visit earthexplorer.usgs.gov
Landsat image of Window Rock, Arizona, acquired on November 3, 2021.
For more information about Landsat, please visit www.usgs.gov/Landsat
To download the data, visit earthexplorer.usgs.gov

Landsat 8 Collection 2 image of the Menindee Lakes in Australia
The Menindee Lakes in the Far West of New South Wales, Australia, are seen in this Landsat 8 Collection 2 image from May 14, 2021, and is shown as a natural color composite using the red, green, and blue bands (Bands 4,3,2).
The Menindee Lakes in the Far West of New South Wales, Australia, are seen in this Landsat 8 Collection 2 image from May 14, 2021, and is shown as a natural color composite using the red, green, and blue bands (Bands 4,3,2).

Landsat 8 Collection 2 image of the Richat Structure
This Landsat 8 Collection 2 image was acquired over the Richat Structure near the western edge of the Sahara Desert on April 25, 2020 and is shown as a natural color composite using the red, green, and blue bands (Bands 4,3,2).
This Landsat 8 Collection 2 image was acquired over the Richat Structure near the western edge of the Sahara Desert on April 25, 2020 and is shown as a natural color composite using the red, green, and blue bands (Bands 4,3,2).

Landsat 8 Image of Lake St. Clair
Landsat captured the tug of war between winter and spring on the heart-shaped Lake St. Clair along the U.S./Canadian border near Detroit.
This Landsat 8 image was acquired on March 6, 2021 and is shown as a natural color composite.
Learn more about the Landsat program at www.usgs.gov/landsat
Landsat captured the tug of war between winter and spring on the heart-shaped Lake St. Clair along the U.S./Canadian border near Detroit.
This Landsat 8 image was acquired on March 6, 2021 and is shown as a natural color composite.
Learn more about the Landsat program at www.usgs.gov/landsat

Landsat 8 Images Labrador
Landsat 8 Surface Reflectance image of the coast of Labrador and Newfoundland
Path 5 Row 23
Date acquired 20210216
Landsat 8 Surface Reflectance image of the coast of Labrador and Newfoundland
Path 5 Row 23
Date acquired 20210216

Landsat 8 image showing northeast Mongolia
Landsat 8 image acquired on November 19, 2020 over northeast Mongolia (Path 127 Row 26). The image is shown using the shortwave infrared 1, near infrared, and red bands (bands 6,5,4).
Landsat Scene ID LC08_L1TP_127026_20201119_20201119_01_RT
Landsat 8 image acquired on November 19, 2020 over northeast Mongolia (Path 127 Row 26). The image is shown using the shortwave infrared 1, near infrared, and red bands (bands 6,5,4).
Landsat Scene ID LC08_L1TP_127026_20201119_20201119_01_RT

Landsat 8 image showing southwest Morocco
Landsat 8 image acquired on November 11, 2020 over southwest Morocco (Path 203 Row 40). The image is shown using the shortwave infrared 2, red, and blue bands (bands 7,4,2).
Landsat Scene ID LO08_L1TP_203040_20201107_20201111_01_T1
Landsat 8 image acquired on November 11, 2020 over southwest Morocco (Path 203 Row 40). The image is shown using the shortwave infrared 2, red, and blue bands (bands 7,4,2).
Landsat Scene ID LO08_L1TP_203040_20201107_20201111_01_T1

Landsat 8 image of Qaidam Basin, China
Featured Landsat Image: Qaidam Basin, China. Landsat 8 image from Path 139 Row 034 acquired on Date 22 October 2020. Shown as a pan-sharpened (Band 8) natural color image using the red, green and blue bands (Bands 4, 3, 2)
Featured Landsat Image: Qaidam Basin, China. Landsat 8 image from Path 139 Row 034 acquired on Date 22 October 2020. Shown as a pan-sharpened (Band 8) natural color image using the red, green and blue bands (Bands 4, 3, 2)

The 9 millionth scene added to the USGS Landsat Archive
The USGS Landsat Archive added its 9 millionth scene to the archive on September 18, 2020. The scene was acquired by Landsat 8 over Northern Paraguay and is shown using bands 6,5,4.
The USGS Landsat Archive added its 9 millionth scene to the archive on September 18, 2020. The scene was acquired by Landsat 8 over Northern Paraguay and is shown using bands 6,5,4.

Cumulative number of scenes in the Landsat Archive
This graphic shows the cumulative number of scenes by path and row in the Landsat archive from 1972 - 2020. This graphic was created on the anniversary of the 9 millionth scene addition to the USGS Landsat Archive.
This graphic shows the cumulative number of scenes by path and row in the Landsat archive from 1972 - 2020. This graphic was created on the anniversary of the 9 millionth scene addition to the USGS Landsat Archive.

Landsat image on the Utah-Arizona Border of the Navajo Nation
Landsat 8 image on the Utah-Arizona Border on the Navajo Nation acquired on September 18, 2020.
For more information about Landsat, please visit www.usgs.gov/Landsat
To download the data, visit earthexplorer.usgs.gov
Landsat 8 image on the Utah-Arizona Border on the Navajo Nation acquired on September 18, 2020.
For more information about Landsat, please visit www.usgs.gov/Landsat
To download the data, visit earthexplorer.usgs.gov

Example of the Landsat 7 ETM+ Collection 2 level-2 science products
Example of the Landsat 7 ETM+ Collection 2 level-2 science products. Left: Landsat 7 level-2 surface reflectance image. Right: Landsat 7 level-2 surface temperature image. The data was acquired on August 19, 2020 (path 179 row 28).
Example of the Landsat 7 ETM+ Collection 2 level-2 science products. Left: Landsat 7 level-2 surface reflectance image. Right: Landsat 7 level-2 surface temperature image. The data was acquired on August 19, 2020 (path 179 row 28).

Landsat 8 image showing Lakes Everard and Harry in S. Australia
Example of the Landsat 8 OLI/TIRS Collection 2 level-1 product. This Landsat 8 image was acquired on August 18, 2020 over Lake Everard and Lake Harry in southern Australia and is shown as a false color composite using the shortwave infrared, near infrared, and red bands (bands 6,5,4).
Example of the Landsat 8 OLI/TIRS Collection 2 level-1 product. This Landsat 8 image was acquired on August 18, 2020 over Lake Everard and Lake Harry in southern Australia and is shown as a false color composite using the shortwave infrared, near infrared, and red bands (bands 6,5,4).

Montana’s Moon-Like Rocks
On August 10, 2018, Operational Land Imager (OLI) on Landsat 8 acquired this image showing part of the Stillwater Complex south of Nye, Montana. Read the original story on NASA Earth Observatory.
On August 10, 2018, Operational Land Imager (OLI) on Landsat 8 acquired this image showing part of the Stillwater Complex south of Nye, Montana. Read the original story on NASA Earth Observatory.