
Figure 1 from a journal article

Detailed Description
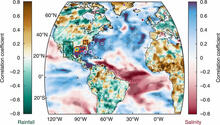
Long-term correlations between observed sea-surface salinity and rainfall. Correlation map between northern Gulf of Mexico sea-surface salinity (SSS; dashed red box) and global oceanic SSS (ORA-S4 data set; red-blue scale), as well as continental precipitation (GPCC data set; brown-green scale) with locations of proxy records used in the study. Proxy locations are marked with circles (sedimentary records), triangles (speleothems), dashed boxes (tree-ring compilations), stars (circulation proxies), and squares (additional proxies) with color fill indicating sign (fresh–blue; dry/wet–brown/green; purple–weakened poleward transport) during the Little Ice Age (1450–1850 C. E.). Correlations were performed with 8-year lowpass filters to reduce sensitivity to interannual variability, where black stippling indicates significance at the 5% confidence level.
Sources/Usage
Public Domain.
Pronounced centennial-scale Atlantic Ocean climate variability correlated with Western Hemisphere hydroclimate
Thirumalai, K., Quinn, T.M., Okumura, Y., Richey, J.N., Partin, J.W., Poore, R.Z., Moreno-Chamarro, E., 2018, Pronounced centennial-scale Atlantic Ocean climate variability correlated with Western Hemisphere hydroclimate, Nature Communications, doi:10.1038/s41467-018-02846-4.