
MODIS satellite image as in Figure 2, showing D8-WY13 dust event
Detailed Description
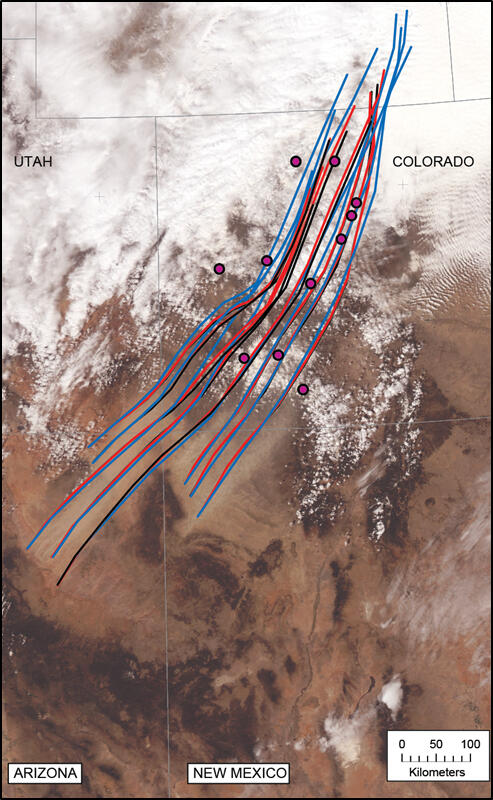
Figure 10. MODIS satellite image as in Figure 2, showing D8-WY13 dust event. Colored lines represent particle trajectories modeled using HYSPLIT (www.arl.noaa.gov/HYSPLIT_info.php) at various altitudes for 12 hours. Black - 100 meters above ground level (MAGL); red - 200 MAGL; blue - 500 MAGL. Dust emitted in the Four Corners region during this event appears to have traveled northeast across the CODOS sites within a 12 hour period.
Sources/Usage
Public Domain.
none