
Visual explanation of the percent buffelgrass raster creation

Detailed Description
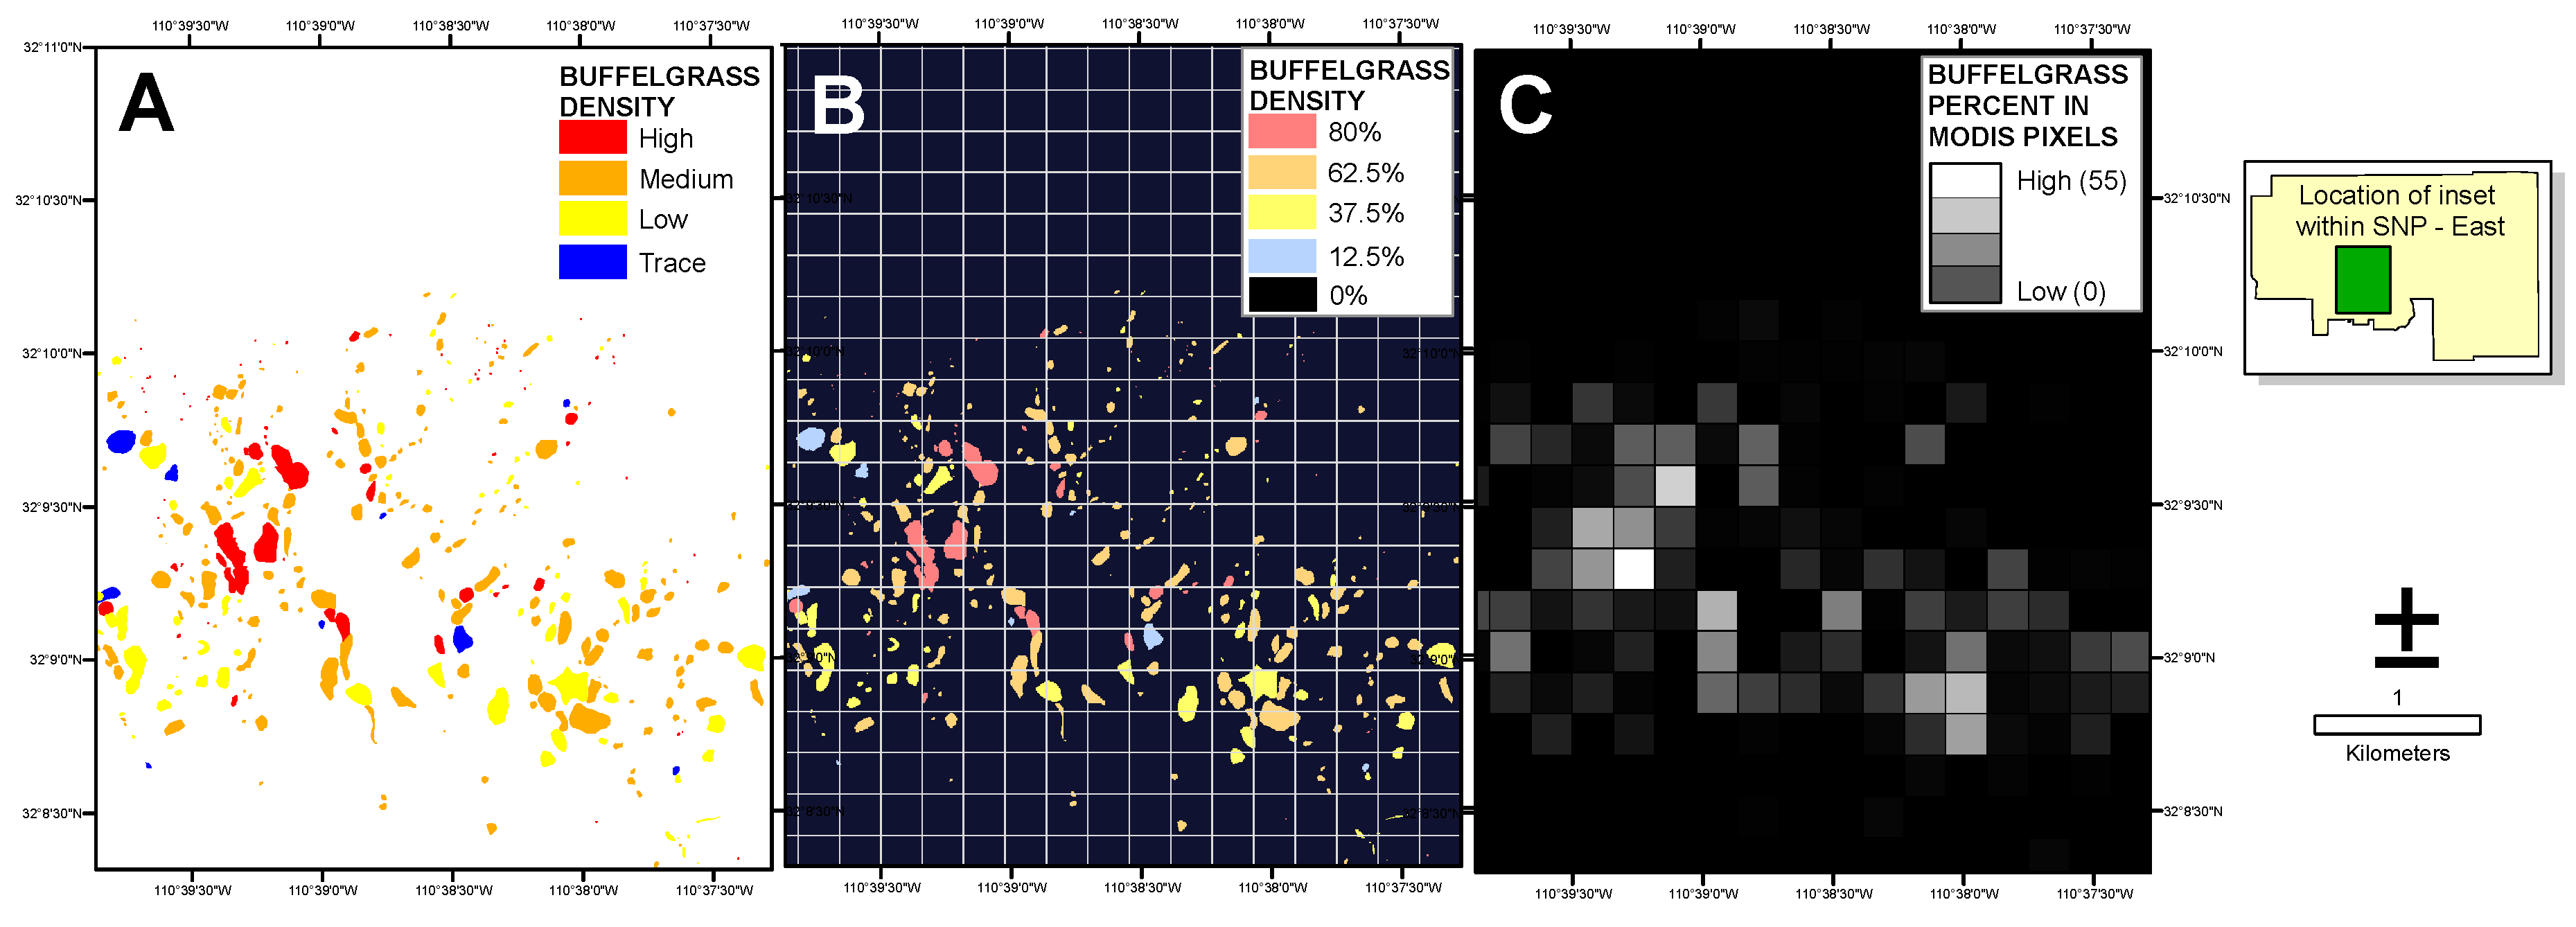
Visual explanation of the percent buffelgrass raster creation. The polygon coverage of categorical buffelgrass density (A) supplied by Saguaro National Park personnel was converted to a 5-m raster with midpoint densities assigned to each category (B); The average density of buffelgrass within each 250-m MODIS pixel cell (white grid in (B)) was then calculated (C).
Figure 3 from Mapping Presence and Predicting Phenological Status of Invasive Buffelgrass in Southern Arizona Using MODIS, Climate and Citizen Science Observation Data in Remote Sensing.