
14 Eye-Opening USGS Images from 2014
As we wind down 2014, let’s refresh your science trivia knowledge and brighten your eyes and brain with a list of fun facts and gorgeous images from USGS.
As we wind down 2014, let’s refresh your science trivia knowledge and brighten your eyes and brain with a list of fun facts and gorgeous images from USGS.
We’ve picked out a few snapshots and videos from the 2014 year of USGS science — a tiny fraction of all the new discoveries, earthly phenomena, and new publications we worked on this past year. It’s impossible to encompass all that we survey for our nation on this planet and beyond, but we hope you enjoy this little visual morsel before we head into another new year. So let’s get started!

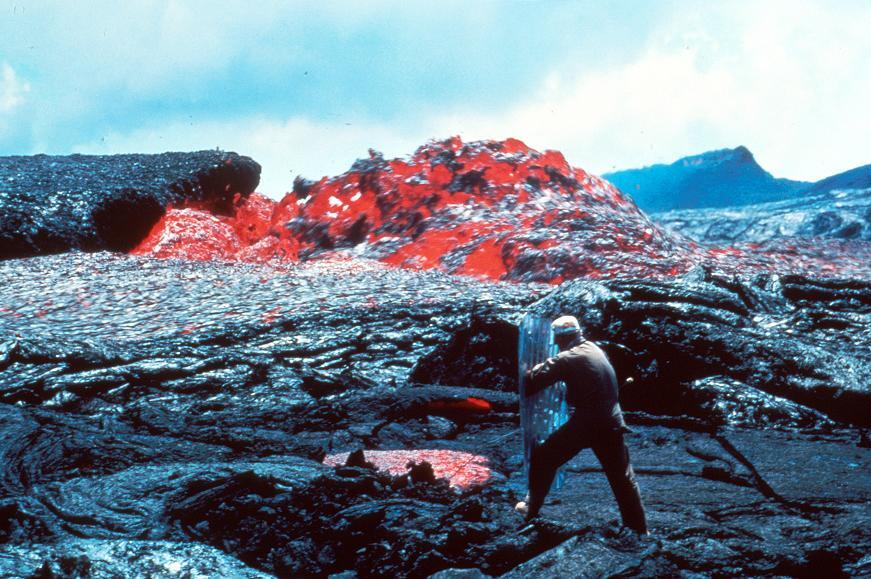
1. Hawaiʻi Hot Lava
After slowly moving downslope from Kīlauea Volcano’s East Rift Zone since June 27, 2014, this active lava flow in Hawaiʻi reached the town of Pāhoa just before Halloween, destroying roads, a cemetery, and private property in this community. Amazingly, the Pu‘u ‘Ō‘ō vent began erupting in 1983 and has continued erupting essentially nonstop for more than 31 years, though this recent flow was the first to threaten homes since 2012. In this photo from October 26, 2014, a USGS geologist is mapping the margin of the active lava flow in an open field west of the town of Pāhoa; the lava has continued its advance as of December. (Photo by USGS Hawaiian Volcano Observatory)
Stay tuned to the USGS Hawaiian Volcano Observatory in January 2015 when they host the annual “Volcano Awareness Month” with many public education events on the Island of Hawaiʻi.
- Read about the Kīlauea lava flow in this USGS Top Story
- Get the latest Kīlauea lava flow update from the USGS Hawaiian Volcano Observatory
- See the latest Kīlauea lava flow photos from USGS
- Get ready for Volcano Awareness Month with USGS in Hawaiʻi
2. Volcano #TBT
If you can stand the heat, study geology! USGS is responsible for issuing “timely warnings” of potential volcanic hazards to emergency-management authorities and to the populace affected. In this photo, a USGS researcher is taking a temperature measurement on a sluggish channel eddy on Kīlauea Volcano in 1984. The research in Hawaiʻi is just one of many projects overseen by the USGS Volcano Hazards Program, which monitors active and potentially active volcanoes, assesses their hazards, responds to volcanic crises, and conducts research on how volcanoes work.
If you’ve been following USGS on Instagram in 2014, then you’ve already seen this crazy classic photo we posted in August as part of the “Throwback Thursday” meme. Follow us on our social media accounts like Instagram, Twitter, and Facebook to keep up with our science photos and videos — as well as glimpses from the past. (Photo by P.W. Lipman/USGS)
- Insta: USGS
- Twitter @USGS
- Like on Facebook
- Zoom in on our U.S. Volcanoes and Current Activity Alerts map
- Find a “Living with a Volcano in Your Backyard” educators guide at the USGS Education website
3. The Largest Earthquake in U.S. History
Forget action movies with computer graphics — major earthquakes are a real phenomenon, and they impact real communities across our nation. March 2014 marked the 50th anniversary of the Great Alaska Earthquake, a magnitude 9.2 event that shifted land downward by 8 feet and upward as much as 38 feet in some locations. USGS scientists were immediately at the frontlines in 1964 studying this catastrophic earthquake — which led to some groundbreaking changes in geologic theories and paved the foundation for our current research and monitoring efforts of earthquakes in the United States.
Premiered in January, our documentary video “The Great Alaska Earthquake,” interviews those same USGS scientists and reflects on the scientific and natural hazard response lessons learned from 1964. (Film directed by Stephen Wessells/USGS)
- Watch “The Great Alaska Earthquake” USGS film (4-minute version)
- Watch “The Great Alaska Earthquake” USGS film (11-minute version)
- Read the USGS blogpost commemorating the 1964 Alaska earthquake
- Read a USGS summary for this 1964 Alaska earthquake

4. Will I Be Shaken or Stirred?
In July 2014, USGS updated the U.S. National Seismic Hazard Maps, which reflect the best and most current understanding of where future earthquakes will occur, how often they will occur, and how hard the ground will likely shake as a result. Along with other data, the updates review new information on East Coast earthquakes, new California faults, and human-induced earthquakes, and helps local governments and communities improve public safety, building design, and insurance practices. (Map by USGS Geologic Hazards Science Center)
Earthquakes pose significant hazards to 75 million Americans in 39 States. The USGS has responsibility for recording and reporting earthquake activity nationwide, and also tracks earthquakes worldwide. And while citizens, emergency responders, and engineers rely on the USGS for accurate and timely information on earthquake events, USGS also relies on you, the public — whenever you fill out the Did You Feel It survey online — which provides valuable data on earthquakes to our scientists!
- Read the our announcement on the new National Seismic Hazard Maps
- Download the full USGS report on these hazard maps
- Report any earthquakes you feel at anytime at the USGS “Did You Feel It?” webpage

5. Yttrium on the Soles of Your Shoes
If you’re admiring the glow of LED tree lights or watching your favorite football team on your LED television this winter season, you have yttrium to thank for that. Named in the 1700s after the Swedish village Ytterby, yttrium is one of the “rare earth elements” very much needed for human technology. The elements yttrium, europium, and terbium are used in fluorescent and LED lighting and televisions.
In May 2014, USGS scientists finished compiling the Geochemical and Mineralogical Maps for the Soils of the Conterminous U.S. — an extraordinary dataset charting the abundance and distribution of chemical elements and minerals — including yttrium — in soils throughout the lower 48 U.S. states at three different soil horizons. This astounding achievement represents a baseline from which any future changes to our soil chemistry may be detected and measured against — information which can improve our nation’s agriculture, land-use planning, and even law enforcement. (Visualization by USGS Central Mineral and Environmental Resources Science Center)
- Explore this USGS interactive portal to look up soil maps for yttrium and other minerals
- Read the USGS blogpost “Get the Dirt on Soil”
- Read a fun “behind the scenes” story from the Associated Press about the field collections leading to these maps
- Discover the uses of yttrium and other rare earth elements in this 2014 USGS factsheet

6. A Cartographer of Mars
In July 2014, USGS completed a global Geologic Map of Mars for our colleagues at NASA. You heard that right — USGS not only creates maps of Earth, but of other planets, too! Using data from the Mars Global Surveyor and Mars Odyssey probes, this is the best map currently available of the geologic units and landforms on the Red Planet. (Map by USGS Astrogeology Science Center)
Maps like these are the work of the USGS Astrogeology Research Program, which works with NASA and other institutions to select landing sites, create mission maps, and carry out scientific investigations on planetary missions. So the next time you look at a Martian or Lunar map online or in your hands, squint and see if you can find the USGS name in the map credits!
- Download the USGS “Geologic Map of Mars” poster
- Spin a Martian globe on USGS YouTube
- Search for heavenly photos of planets and moons in the USGS “Astropedia”
- Meet the USGS astrogeologists

7. Watching Over Earth
Of course, USGS is best known for training its eye on the changes and rhythms of Planet Earth. Much of this work is thanks to the Landsat Missions, a joint program between USGS and NASA, wherein the USGS operates satellites that help us scan the Earth’s surface for natural and man-made changes. The first satellite, Landsat 1, was launched in 1972, and the latest mission, Landsat 8, celebrated its first birthday on February 11, 2014.
The Landsat missions have now collected over 42 years of global land imagery data. One benefit of this incredible record is the ability to visualize landscape conditions, such as drought impacts to California. The decrease of winter snow cover in the Sierra Nevada Mountains can be seen in this progression of images, captured by Landsat in February 2011, 2013, and 2014. California is heavily dependent on large Sierra Nevada snowpacks to replenish its annual water supply and sustain its vast agricultural lands and diverse ecosystems, and this satellite record underscores the current water shortage plight of the Golden State. (Image by USGS/NASA)
- Find this California drought image at the Landsat Missions gallery
- Learn the historic importance of the Landsat program
- Celebrate the first year of Landsat 8
- Fall in love with “Earth As Art” at the USGS EROS program
- Take a closer look at Earth with the USGS 3D Elevation Program
- Visit the USGS California Drought webpage

8. Top of the Topo
USGS has always been known for its maps, and we are still in the business. However, topographic maps — the essential tool for planners, hikers, emergency response crews, and other professionals and enthusiasts — have caught up with the digital age. US Topo Maps are now delivered in PDF format with geospatial extensions via GeoPDF®, which allows layers of information to be turned on or off, and provides flexible zooming and printing options. Our maps are available as free downloads via the USGS Map Locator at the USGS Store, making it easy for anyone to grab map PDFs for their tablets or smartphones before heading out for some outdoor sightseeing.
And what were the most downloaded US Topo Maps in 2014? At the top is the Washington West quadrangle, featuring the District of Columbia. Other interesting top downloads include Santa Fe, New Mexico; Moab, Utah; Central Park in New York and Yuma in Michigan!
- Download this Washington D.C. US Topo Map (42.2 MB zip file)
- Look up the free US Topo map for your neighborhood with the USGS Map Locator
- Find reprints of historic maps at The USGS Store
- A user’s guide to exploring and downloading US Topo maps from USGS

9. Attack of the Hydrologist Clones
No, USGS isn’t cloning hydrologists or hiring lesser-known X-Men to do science. This is a time-lapse composite photograph from December showing a USGS technician crossing a stream near Thompson Falls, Montana, to measure water flow at different points across a stream transect. This is just one of the many scientific duties of the USGS Water Mission Area. (Photo by Dan Hess/USGS)
USGS provides NOAA’s National Weather Service with stream data for critical flood warnings. Additionally, these stream surveys allow scientists to compute the streamflow of rivers across the United States, and help with fish habitat restoration, and other ecosystem studies. Advanced computer models and long-term analyses are of little use without the data collected by technicians and scientists working long, hard days in the field!

10. Dreaming of Streams in Green
USGS operates about 7,400 streamgages around the United States, including this gage photographed in August 2014 in the serene, verdant woods of Little Back Creek, located within the George Washington National Forest in Virginia. You can find this photo in the USGS Flickr gallery. (Photo Credit: Alan Cressler/USGS)
Streamgages are operated by the USGS National Streamflow Information Program (NSIP), whose mission is to provide real-time streamflow data to local, state, regional, and national leaders, so communities can continuously monitor changes in their local waters, track drought and flood conditions, and manage accordingly.
- Check the current stream conditions of Little Back Creek
- Look for other stream gages operated by the USGS National Streamflow Information Program
- Celebrate the first-ever USGS streamgage
- Search for this and other beautiful images at the USGS Flickr page

11. Interactive Energy
Investigating natural sources of energy has always been a task for USGS, helping our nation study and assess the location, quantity, and quality of energy resources, including the economic and environmental effects of resource extraction and use. From the exploration assessment of oil and natural gas to habitat restoration after dam removals, USGS has evolved with the changing needs and considerations of energy use in the United States.
In February 2014, USGS unveiled windFarm, an interactive app mapping wind energy turbines around the United States, visualizing a never-before-assembled national dataset for anyone to access online. Knowing the location of individual turbines, their make, model, height, blade area, and capacity offers important information for land and resource managers and scientists studying wildlife-turbine collisions or interactions between wind turbines and ground-based radar. Click on the link to give it a spin!
- Open the USGS windFarm app to see the interactive map of U.S. wind turbines
- Read the USGS blogpost on “Mapping the Nation’s Wind Turbines”
- Drill into the USGS Energy Resources Program
- Read about USGS research on wildlife and renewable energy interactions
- Watch a supercomputer visualization of 3-D condor airspace

12. Bee Butts Break the Internet?
Not quite, but they are still amazing to look at! This macrophotograph uploaded in November 2014 shows the bee-hind of a “plain sweat bee” (Lipotriches spp.) collected from Australia. This stunning image is part of the collection made by the USGS Native Bee Inventory and Monitoring Program, which develops identification tools for native bee species in the United States and elsewhere. This virtual museum provides a critical service for scientists studying bees around the world, their role in the pollinating our plants and crops, and why they are suffering from declines. (Photo by USGS Native Bee Inventory and Monitoring Program)
USGS also manages similar monitoring programs and information hubs on other species issues, including amphibian decline (Amphibian Research and Monitoring Initiative) and aquatic invasive species (Nonindigenous Aquatic Species).
- Download this photo from the USGS Bee Inventory and Monitoring Program’s Flickr page
- Watch a video tutorial on insect photography with USGS scientist Sam Droege
- Learn about the USGS Amphibian Research and Monitoring Initiative (ARMI)
- Learn about the Nonindigenous Aquatic Species program (NAS)
13. From a Polar Bear Point of View
This is no footage from a soda pop television commercial: A USGS researcher attached video cameras to four female polar bears as part of a study on how bears expend their energy. In this video cut we posted online in June 2014, you can see polar bears swim in arctic waters, tackle a dead seal meal — and nuzzle with another bear.
Combined with satellite telemetry data, behavior observations like this help scientists understand how much food and rest bears need to survive, and whether environmental change like decreased sea ice are stressing this threatened species. The ongoing research is part of the USGS Changing Arctic Ecosystems Initiative, one of many USGS research programs on wildlife populations, climate change, and land use change. (Footage by USGS; edited by Stephen Wessells/USGS)
- Read the USGS news release explaining this polar bear video
- Learn about USGS Climate and Land Use research
- Learn about the USGS Climate Change and Wildlife Science Center
- Find other USGS news releases from 2014
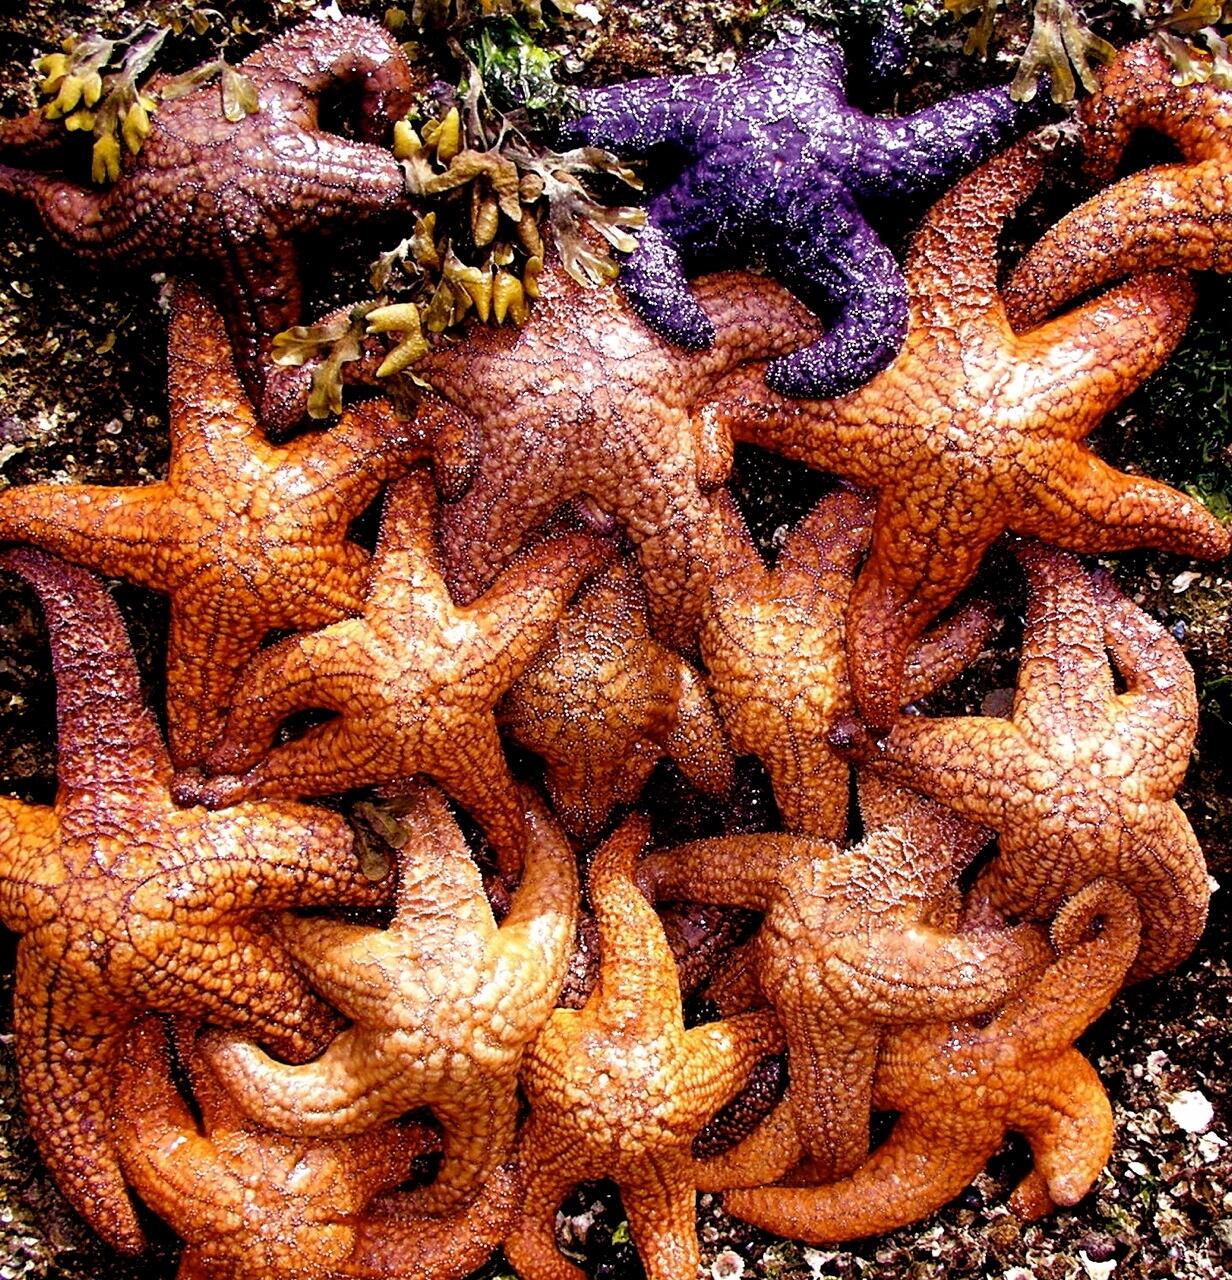
14. Falling Sea Stars
Tidepool scenes of vibrantly colored sea stars like this one in San Juan Islands, Washington, could become a rare sight as the Sea Star Wasting Disease spreads. The disease causes sea stars to fall apart and disintegrate within days, and has been killing these sea creatures in droves from Mexico to Alaska. In November 2014, a new Cornell University study with assistance from USGS scientists finally pointed to a prime suspect in the deadly epidemic: a previously unknown virus. (Photo by Kevin Lafferty/USGS)
- Download this and other sea star photos at the USGS Multimedia Gallery
- Read our blogpost on the viral discovery behind the Sea Star Wasting Disease
- Check in to the USGS National Wildlife Health Center
- Learn about USGS Ecosystems research
Research and monitoring of ecosystem trends, water resources, natural hazards, environmental health, and climate change are important elements of the USGS mission, which has grown from its roots in geology and mapping. Today’s USGS looks much different than the one that began 135 years ago under President Rutherford B. Hayes, and the scientific methods and survey scope our agency is charged with today were probably undreamed of in the 1870s — now in all 50 states and U.S. territories, with partner nations around the world, and on other planetary bodies in the Solar System.
So look around in our changing world — you’ll be surprised where you can find USGS!
Additional assistance by Paul Laustsen, Scott Horvath, Ryan McClymont, Mark Newell, Steve Sobieszczyk, and Amelia Barrales, with material previously written by Leslie Gordon, Alex Demas, Jessica Robertson, Mark Petersen, and other USGS and NASA staff.
Get Our News
These items are in the RSS feed format (Really Simple Syndication) based on categories such as topics, locations, and more. You can install and RSS reader browser extension, software, or use a third-party service to receive immediate news updates depending on the feed that you have added. If you click the feed links below, they may look strange because they are simply XML code. An RSS reader can easily read this code and push out a notification to you when something new is posted to our site.