
Fifty Years of Landsat: Impartial Eye on Climate Change
Part 4 of a Six-part Series Highlighting the 50th Anniversary of Landsat
Landsat, a space-based Earth observation program conducted jointly by the U.S. Geological Survey and NASA, celebrates a half century of providing a continuous record of the Earth’s land surfaces during 2022.
Since its inaugural launch on July 23, 1972, an uninterrupted series of Landsat satellites has compiled a nearly comprehensive portrait of Earth that has enabled scientists and analysts around the globe to detect and monitor critical changes in the land and its resources.

More images, fewer words
The Landsat archive of decades of change on the Earth is a brilliant starting point for a rigorous scientific analysis of climate change. The Landsat record stretches for a half century, long enough for climate trends to be detected. Landsat’s automated collecting mechanisms are starkly transparent. Its data are carefully calibrated to allow for technical advancements in instrumentation while still enabling valid comparisons across many years. Furthermore, the entire data archive is freely available to any analyst around the world.
Even the briefest outline of the causes and the consequences of changes in Earth systems would be far beyond the scope of this article. However, by reviewing a selection of climate-induced changes as recorded by Landsat satellites in the form of a short pictorial essay, we can begin to understand how the Landsat program provides critical evidence and insight for climate change analyses and projections.
Glacier retreat
Among the most dramatic evidence that Earth's climate is warming is the retreat and disappearance of mountain glaciers around the world. Based on preliminary data for 2019-2020, 2020 was the 33rd year in a row that glaciers tracked by the World Glacier Monitoring Service lost rather than gained ice.
Originally, scientists studied glaciers primarily for the clues they offered about Earth’s climate during past ice ages and the role they played in shaping the landscape. Today, scientists are also trying to understand how quickly human-caused climate change will cause many glaciers to disappear altogether.
This USGS Landsat 8 image shows the extent of Bear Glacier (upper) and Aialik Glacier (lower) on Alaska’s Kenai Peninsula, as of September 4, 2018. Both glaciers have retreated significantly since the launch of the first Landsat satellite in 1972. Scientists can access Landsat’s deep historical archive to analyze glacial dynamics.
Sea Level Rise
Currently, sea level is rising about one-eighth of an inch per year but is projected to increase in the future. By 2100, sea levels may rise another one to eight feet.
Sea level can rise by two different mechanisms with respect to climate change. First, as the oceans warm due to an increasing global temperature, seawater expands—taking up more space in the ocean basin and causing a rise in water level. The second mechanism is the melting of ice over land, which then adds water to the ocean.
How river deltas will respond to climate change is a complex, multifaceted issue. Due to historical and economic factors, a disproportionately large percentage of the global population lives on river deltas around the world, such as the Mississippi Delta shown here. Many of them are subsiding (sinking), often at twice the mean rate of sea level rise. The subsidence is due to a combination of factors like the natural settling of sediments, groundwater and oil extraction, and the extra weight of buildings. Inland dam construction and land management practices can also starve deltas of the raw material needed to replenish and build coastal land. Scientists can begin to trace the intricate causes and effects of dams and certain land management practices by referring to the historical catalog of Landsat imagery.

Source: USGS/NASA Landsat. Public domain.
Extreme storms
It is difficult, if not impossible, to assess the added impact that anthropogenic warming (climate change) may have in any particular storm. Due to regional weather conditions, Hurricane Harvey was an especially slow-moving tropical system. It dropped record amounts of rain.
One of the most visible consequences of a warming world is an increase in the intensity and frequency of extreme weather events. The National Climate Assessment conducted by the U.S. Global Change Research Program finds that the number of heat waves, heavy downpours, and major hurricanes has increased in the United States. Climate change is expected to worsen the frequency, intensity, and impacts of some types of extreme weather events. For example, sea level rise increases the impacts of coastal storms and warming can place more stress on water supplies during droughts.


Extreme Heat
Climate projections indicate that extreme heat events will be more frequent and intense in coming decades. Urban heat islands, combined with an aging population and increased urbanization, are projected to increase the vulnerability of urban populations to heat-related health impacts.
More than eight million people live in New York City, but they’re not all at equal risk of heat stress. Some areas are hotter than others, forming urban heat hotspots within an overall urban heat island. These hot spots usually occur where impervious manmade materials, such as asphalt, soak up and hold more solar radiation than the trees and grass in cooler areas.
The Thermal Infrared Sensor (TIRS) onboard Landsats 8 and 9 measures land surface temperature with a technology that applies quantum physics to detect heat. TIRS was added to the Landsat mission when it became clear how much state water resource managers relied on the measurements of Earth’s thermal energy that were obtained by Landsat 8’s predecessors, Landsats 5 and 7. With nearly 80 percent of the fresh water in the western United States being used to irrigate crops, TIRS is an invaluable tool for managing water consumption.
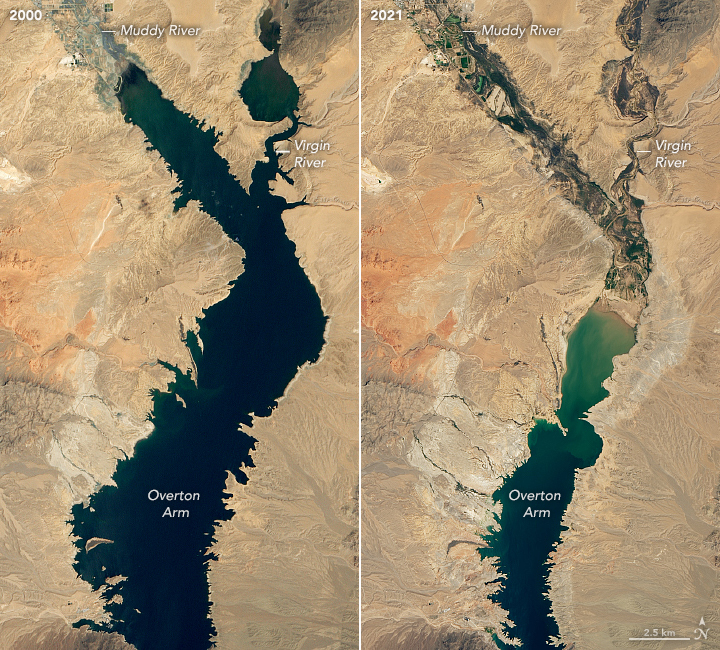
Drought
Lake Mead, the largest reservoir in the United States, is part of a system that supplies water from the Colorado River to at least 40 million people across seven U.S. states. As of August 22, 2021, Lake Mead was filled to just 35 percent of its capacity. In June 2022, the reservoir had fallen to 29 percent capacity, an all-time low.
Climate change exacerbates droughts by making them more frequent, longer, and more severe. Since 2000, the western United States has experienced some of the driest conditions on record. The southwestern United States, in particular, is going through an unprecedented period of extreme drought. The long time series of Landsat imagery that began in 1972 enables scientists to accurately compare drought conditions in a particular area through recent decades.
Tracking change since 1972
In a September 1966 press release, then Secretary of the Interior Stewart Udall boldly announced that the U.S. Department of the Interior was launching "Project EROS” (Earth Resources Observation Satellites) to collect invaluable information about Earth through remote sensing by satellites. This remarkably ambitious project, later renamed Landsat, supported the mandate that Congress set for the U.S. Geological Survey when the agency was established in 1879: “classification of the public lands, and examination of the …products of the national domain.” Secretary Udall’s further vision was "to observe the Earth for the benefit of all," a reference to the concept of the peaceful international use of outer space subsequently established in a 1967 United Nations treaty. The first satellite in the Landsat series was launched July 23, 1972.
Landsat’s fifty-year record of consistent Earth observation supplies the world with an unparalleled baseline of trusted, empirical evidence to support an understanding of both the causes and the consequences of climate change. Massive volumes of carefully calibrated Landsat data allow observations from one period or one geographic area to be compared to others accurately across time and geographic locations, enabling scientific insights that no other single data source can provide.
Looking back, looking ahead
Looking beyond the current Landsat 8 and 9 satellites to another mission by the end of the decade, a joint NASA-USGS design team has identified an affordable, next-generation concept for the Landsat Next mission. Its planned specifications respond to rigorously documented system requirements to meet ever-increasing user needs to better monitor, understand, and eventually predict changes to our Nation’s land surfaces, farmlands, forests, surface waters, and coastlines.
Landsat Next is planned to provide higher spatial resolution and twice the spectral imaging bands of Landsat 8 and 9. The mission will maintain compatibility with the existing Landsat data record and be augmented by new commercial and international data partnerships. These advancements will markedly improve our monitoring and predictive capabilities for agriculture, harmful algal blooms, water use, mineral mapping, and volcanic activity, among other phenomena.
Collectively, these capabilities will ensure that Landsat continues to draw an even more extensive, uninterrupted, and insightful portrait of our planet for the benefit of all.
------
The Landsat Program, a joint mission of the U.S. Geological Survey and NASA, has provided continuous global coverage of landscape change since 1972. Landsat’s unique long-term data record provides the basis for a critical understanding of environmental and climate changes occurring in the United States and around the world.
Learn more
Fourth National Climate Assessment
In case you missed it
Parts 1, 2, and 3 of the Six-Part Series Highlighting the 50th Anniversary of Landsat:
Fifty Years of Landsat: Pioneer in Promoting Food Security from Space
Fifty Years of Landsat: Sharing Earth information for the benefit of all
Fifty Years of Landsat: Observing Global Forests from above the Canopy
Get Our News
These items are in the RSS feed format (Really Simple Syndication) based on categories such as topics, locations, and more. You can install and RSS reader browser extension, software, or use a third-party service to receive immediate news updates depending on the feed that you have added. If you click the feed links below, they may look strange because they are simply XML code. An RSS reader can easily read this code and push out a notification to you when something new is posted to our site.