
Overlooking the Alaka‘i Plateau from the Alaka‘i Swamp trailhead, Kaua‘i, Hawai‘i.
Images
Explore our planet through photography and imagery, including climate change and water all the way back to the 1800s when the USGS was surveying the country by horse and buggy.
Filter Total Items: 21609

Overlooking the Alaka‘i Plateau, Kaua‘i
Overlooking the Alaka‘i Plateau from the Alaka‘i Swamp trailhead, Kaua‘i, Hawai‘i.

Presenters at a USGS-sponsored session at SACNAS
The Society for Advancement of Chicanos/Hispanics and Native Americans in Science (SACNAS) held a conference in Long Beach, California, from October 13–15, 2016. Presenters at the conference in the USGS-sponsored session titled, “Clocks in the Rocks, Coral, and Wood: Dating Techniques That Keep Ti
The Society for Advancement of Chicanos/Hispanics and Native Americans in Science (SACNAS) held a conference in Long Beach, California, from October 13–15, 2016. Presenters at the conference in the USGS-sponsored session titled, “Clocks in the Rocks, Coral, and Wood: Dating Techniques That Keep Ti
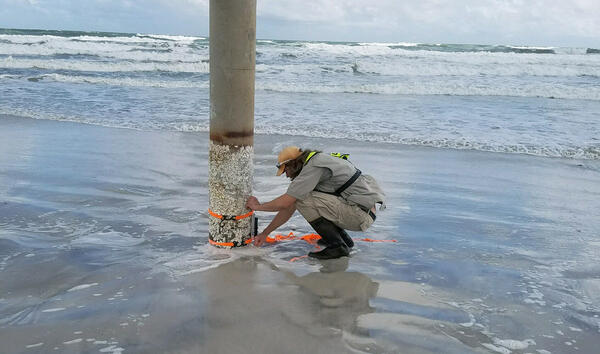
Storm-tide sensor installation
Ryan Patrick, USGS hydrologist, installs a storm-tide sensor in preparation for Hurricane Matthew. The data collected by these sensors is used to create better storm-tide models, more accurate flood forecasts, more effective flood-protection infrastructure, and wiser land use policies.
Ryan Patrick, USGS hydrologist, installs a storm-tide sensor in preparation for Hurricane Matthew. The data collected by these sensors is used to create better storm-tide models, more accurate flood forecasts, more effective flood-protection infrastructure, and wiser land use policies.

Toxic Water Filtering
Toxic water being centrifuged and filtered at OGRL.
Toxic water being centrifuged and filtered at OGRL.

Biocrust
On the Colorado Plateau, mature biocrusts are bumpy and dark-colored due to the presence of lichens, mosses, and high densities of cyanobacteria and other organisms. Disturbed biocrusts are lighter in color, looking more like the underlying sand than undisturbed ones, and are less capable of stabilizing soils or providing soil fertility.
On the Colorado Plateau, mature biocrusts are bumpy and dark-colored due to the presence of lichens, mosses, and high densities of cyanobacteria and other organisms. Disturbed biocrusts are lighter in color, looking more like the underlying sand than undisturbed ones, and are less capable of stabilizing soils or providing soil fertility.

Dark-colored mature biocrust
On the Colorado Plateau, mature biocrusts are bumpy and dark-colored due to the presence of lichens, mosses, and high densities of cyanobacteria and other organisms. These organisms perform critical functions, such as fertilizing soils and increasing soil stability, therefore reducing dust.
On the Colorado Plateau, mature biocrusts are bumpy and dark-colored due to the presence of lichens, mosses, and high densities of cyanobacteria and other organisms. These organisms perform critical functions, such as fertilizing soils and increasing soil stability, therefore reducing dust.

Footprint damage to biocrusts
Many human activities can be unintentionally harmful to biological crusts. The biocrusts are no match for the compressional stress caused by footprints of livestock or people or tracks from vehicles.
Many human activities can be unintentionally harmful to biological crusts. The biocrusts are no match for the compressional stress caused by footprints of livestock or people or tracks from vehicles.

USGS scientist Jayne Belnap examines instruments to measure biocrust
USGS scientist Jayne Belnap examines instrumentation to measure photosynthetic rates of biocrusts.
USGS scientist Jayne Belnap examines instrumentation to measure photosynthetic rates of biocrusts.

View from Canyonlands Research Center
View from Canyonlands Research Center.
View from Canyonlands Research Center.

False-color-composite satellite image of Great Salt Lake, Sept 2016
This is a false-color-composite satellite image of Great Salt Lake, Utah, Sept 2016. Vegetation appears red in image.
This is a false-color-composite satellite image of Great Salt Lake, Utah, Sept 2016. Vegetation appears red in image.

NM Boys and Girls Ranch Wetlands Hydrologic Assessment: An Interagency
NM Boys and Girls Ranch Wetlands Hydrologic Assessment: An Interagency
NM Boys and Girls Ranch Wetlands Hydrologic Assessment: An Interagency

Using radio telemetry
Don Ashton uses radio telemetry to track a federally threatened Oregon spotted frog (Rana pretiosa). Data provide information on resource use, movement patterns, and overwintering
Don Ashton uses radio telemetry to track a federally threatened Oregon spotted frog (Rana pretiosa). Data provide information on resource use, movement patterns, and overwintering

Images of heart, pancreas, lung, and brain tissue from gyrfalcon
A. Heart, multifocal and focally extensive necrotizing myocarditis. H&E. Inset: Section of same heart tissue; immunohistochemical staining of influenza A virus antigen is strongly positive in areas of necrosis. B. Pancreas, multifocal and focally extensive necrosis of the acinar epithelium. H&E.
A. Heart, multifocal and focally extensive necrotizing myocarditis. H&E. Inset: Section of same heart tissue; immunohistochemical staining of influenza A virus antigen is strongly positive in areas of necrosis. B. Pancreas, multifocal and focally extensive necrosis of the acinar epithelium. H&E.

The rise and fall of Kīlauea's summit lava lake
Since early September 2016, Kīlauea's summit lava lake level has fluctuated, as shown in these side-by-side webcam images. On September 10 (left), the summit lava lake rose to within 5 m (16 ft) of the vent rim, only to drop the next day with the onset of summit deflation.
Since early September 2016, Kīlauea's summit lava lake level has fluctuated, as shown in these side-by-side webcam images. On September 10 (left), the summit lava lake rose to within 5 m (16 ft) of the vent rim, only to drop the next day with the onset of summit deflation.

USGS attendees at 6th International Symposium of Deep Sea Corals
Six USGS scientists presented their research at the 6th International Symposium on Deep-Sea Corals in September, 2016. This all-female force hailed from USGS centers in West Virginia, California, and Florida. Left to right: Jill Bourque, Cheryl Morrison, Nancy Prouty, Katharine Coykendall, Amanda Demopoulos, Christina Kellogg.
Six USGS scientists presented their research at the 6th International Symposium on Deep-Sea Corals in September, 2016. This all-female force hailed from USGS centers in West Virginia, California, and Florida. Left to right: Jill Bourque, Cheryl Morrison, Nancy Prouty, Katharine Coykendall, Amanda Demopoulos, Christina Kellogg.

Arctic bluff erosion
USGS is studying climate change impacts to U.S. Pacific and Arctic coasts. Alaska’s north coast is predominantly erosional, retreating on average about 1.4 meters per year.
USGS is studying climate change impacts to U.S. Pacific and Arctic coasts. Alaska’s north coast is predominantly erosional, retreating on average about 1.4 meters per year.

Biocrust outdoor testing plots
USGS scientists created outdoor testing plots where large squares of biocrusts were exposed to different warming and precipitation factors over time.
USGS scientists created outdoor testing plots where large squares of biocrusts were exposed to different warming and precipitation factors over time.

Biocrust outdoor testing plots.
USGS scientists created outdoor testing plots where large squares of biocrusts were exposed to different warming and precipitation factors over time.
USGS scientists created outdoor testing plots where large squares of biocrusts were exposed to different warming and precipitation factors over time.

Biocrusts provide soil stability and prevent erosion
Biocrusts provide soil stability and prevent erosion. Soil is the foundation where plants live; if soil is not stable, native plants can have difficulty growing.
Biocrusts provide soil stability and prevent erosion. Soil is the foundation where plants live; if soil is not stable, native plants can have difficulty growing.

Cedar River Surges to Second-Highest Level in Eastern Iowa
Images from Landsat 8's Operational Land Imager sensor show the dramatic transformation of the river as it flows toward Cedar Rapids. On July 8, 2016, the shallow river meanders into the city, surrounded by green crops in the heart of the growing season.
Images from Landsat 8's Operational Land Imager sensor show the dramatic transformation of the river as it flows toward Cedar Rapids. On July 8, 2016, the shallow river meanders into the city, surrounded by green crops in the heart of the growing season.