


Stratified sand in an excavation near the Connecticut River in Portland, Connecticut. The sand was deposited as a delta in a glacial lake that occupied the Connecticut River Valley about 18,000-19,000 years ago.
John R Mullaney
John Mullaney is a Hydrologist in the New England Water Science Center.
John serves as the Center Groundwater Specialist. He began working for the USGS in 1986, and has worked on a wide variety of groundwater and water-quality studies in Connecticut and other parts of New England.
Current projects include:
- National surveillance of the status of groundwater levels in the United States
- Evaluation of the effects of bottled water extraction in the Saco River Basin, New Hampshire and Maine
- Evaluation of nitrogen loads to Long Island Sound from the major tributaries
- Analysis of tidal groundwater levels in the vicinity of the Herring River, Lower Cape Cod, as part of a proposed tidal marsh restoration at the Cape Cod National Seashore
- Development of tools using R computing environment for review of water-quality and groundwater-level data
- Development of web pages using the R computing environment for display of USGS data
Highlights of past work:
- Analysis of long-term nutrient trends and loads to Long Island Sound and Narragansett Bay
- Analysis of water quality in Connecticut in the four decades since the Clean Water Act
- Modeling nitrogen loads from groundwater to streams and Long Island Sound
- Use of surrogate methods to determine total nitrogen concentrations in the lower Connecticut River from sensor data
- Analysis of the effects of road deicing on groundwater and surface water quality
- Investigation of the effects of sea-level rise on groundwater levels in New Haven, Connecticut
- Modeling groundwater flow and water use from a crystalline bedrock aquifer, southwestern Connecticut
- Assessment of the hydrogeology and water-quality of a large Superfund site in southwestern Connecticut
- Studies of groundwater and surface water quality with the USGS National Water Quality Assessment Program (NAWQA)
- Mapping the geohydrology of the Upper Connecticut and Androscoggin Basins, northern New Hampshire
- Statewide assessment of pesticides in groundwater in Connecticut
Science and Products
Chloride Data for Streams in Connecticut, Massachusetts, and Rhode Island
As part of water-quality data collection activities in New England, water samples are analyzed for chloride in monitoring networks and projects across Connecticut, Massachusetts, and Rhode Island. Chloride is of interest because high concentrations may affect aquatic life in streams or affect water quality of reservoirs and aquifers used for drinking water.
New England Drought, 2020
Below average and infrequent rainfall from May through September 2020 led to an extreme hydrologic drought across much of New England, with some areas experiencing a flash (quick-onset) drought.
New England Drought Information
Droughts are one of the most expensive and damaging hydrologic hazards in the United States. They are generally slow in developing, frequently occur over a long period of time, and can affect large areas and populations.
Development of a Regional-Scale Model to Simulate Groundwater Flow and Nitrogen Loading in Watersheds Along the Connecticut Coast of Long Island Sound
In 2018 USGS began work on the development of regional-scale groundwater flow and nitrogen transport models of areas along the Connecticut coast. The model will be used as a quantitative tool to evaluate groundwater flow and nitrogen loading to Long Island Sound.
Groundwater and Surface-Water Monitoring in the Mill Creek Watershed, Wellfleet and Truro, Massachusetts
The Herring River estuary and salt marsh system, within the Cape Cod National Seashore in Wellfleet, Massachusetts, has been diked off from the ocean for more than 100 years. The National Park Service is now preparing to restore the 1,100 acre estuary-marsh system.
Updating a Method to Estimate Probable High Groundwater Levels in Massachusetts
Periodic high groundwater levels are a major cause of septic system-failures, wet basements, and other problems for suburban and rural residents in Massachusetts. To address this issue, a method (commonly referred to as the Frimpter method) was developed in early 1980’s to estimate probable high groundwater levels across the state. The USGS New England Water Science Center, in cooperation with the...

Stratified Sand
Stratified sand in an excavation near the Connecticut River in Portland, Connecticut. The sand was deposited as a delta in a glacial lake that occupied the Connecticut River Valley about 18,000-19,000 years ago.
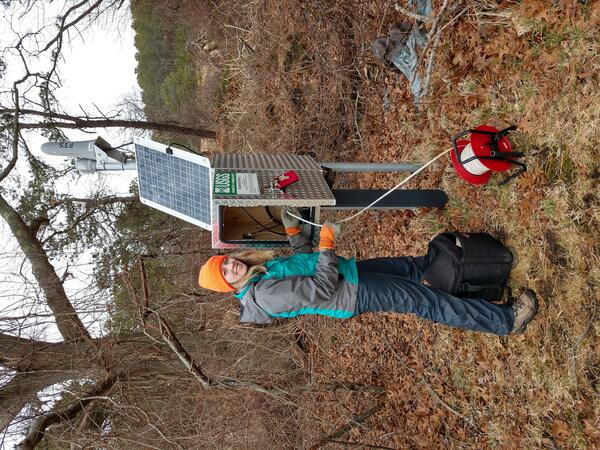
Groundwater Well in Mill Creek Basin in Cape Cod National Seashore
A Geoscientist-in-the-Park Guest Scientist for the National Park Service services a USGS groundwater well located within the Mill Creek basin near the Herring River in Wellfleet, Massachusetts.
A Geoscientist-in-the-Park Guest Scientist for the National Park Service services a USGS groundwater well located within the Mill Creek basin near the Herring River in Wellfleet, Massachusetts.

Tidal Water Moving through a Tide Control Structure in Wellfleet, Massachusetts
A gage on the backside of a tide control structure on the Herring River at Chequessett Neck Rd at Wellfleet, Massachusetts. It is evident to see the movement of incoming tide in this picture. Data was collected at this site for several years prior to the removal of the dike in 2023.
A gage on the backside of a tide control structure on the Herring River at Chequessett Neck Rd at Wellfleet, Massachusetts. It is evident to see the movement of incoming tide in this picture. Data was collected at this site for several years prior to the removal of the dike in 2023.


Cape Cod National Seashore
A look to the north along the bluffs at the Cape Cod National Seashore, from Marconi Station. Over the years, the USGS continues to work with the National Park Service at the Cape Cod National Seashore.
A look to the north along the bluffs at the Cape Cod National Seashore, from Marconi Station. Over the years, the USGS continues to work with the National Park Service at the Cape Cod National Seashore.

Storm-tide sensor installation before Hurricane Sandy
Hydrologic technician installs a storm-tide sensor ahead of Hurricane Sandy in Milford Harbor, Connecticut.
Hydrologic technician installs a storm-tide sensor ahead of Hurricane Sandy in Milford Harbor, Connecticut.

Storm surge sensor deployment on the Saugatuck River
USGS hydrologist holding a dry erase board to identify the storm surge sensor location deployment on August 27, 2011. The sensor is strapped to the back of a dock piling on the Saugatuck River in Westport, CT owned by the Saugatuck River Rowing Club.
USGS hydrologist holding a dry erase board to identify the storm surge sensor location deployment on August 27, 2011. The sensor is strapped to the back of a dock piling on the Saugatuck River in Westport, CT owned by the Saugatuck River Rowing Club.

Storm surge sensor deployment on the Housatonic River
USGS hydrologist pointing to the location of a storm surge sensor deployment near the mouth of the Housatonic River in Stratford, CT at the Sikorsky aircraft facility on August 27, 2011.
USGS hydrologist pointing to the location of a storm surge sensor deployment near the mouth of the Housatonic River in Stratford, CT at the Sikorsky aircraft facility on August 27, 2011.
Science and Products
- Science
Chloride Data for Streams in Connecticut, Massachusetts, and Rhode Island
As part of water-quality data collection activities in New England, water samples are analyzed for chloride in monitoring networks and projects across Connecticut, Massachusetts, and Rhode Island. Chloride is of interest because high concentrations may affect aquatic life in streams or affect water quality of reservoirs and aquifers used for drinking water.New England Drought, 2020
Below average and infrequent rainfall from May through September 2020 led to an extreme hydrologic drought across much of New England, with some areas experiencing a flash (quick-onset) drought.New England Drought Information
Droughts are one of the most expensive and damaging hydrologic hazards in the United States. They are generally slow in developing, frequently occur over a long period of time, and can affect large areas and populations.Development of a Regional-Scale Model to Simulate Groundwater Flow and Nitrogen Loading in Watersheds Along the Connecticut Coast of Long Island Sound
In 2018 USGS began work on the development of regional-scale groundwater flow and nitrogen transport models of areas along the Connecticut coast. The model will be used as a quantitative tool to evaluate groundwater flow and nitrogen loading to Long Island Sound.Groundwater and Surface-Water Monitoring in the Mill Creek Watershed, Wellfleet and Truro, Massachusetts
The Herring River estuary and salt marsh system, within the Cape Cod National Seashore in Wellfleet, Massachusetts, has been diked off from the ocean for more than 100 years. The National Park Service is now preparing to restore the 1,100 acre estuary-marsh system.Updating a Method to Estimate Probable High Groundwater Levels in Massachusetts
Periodic high groundwater levels are a major cause of septic system-failures, wet basements, and other problems for suburban and rural residents in Massachusetts. To address this issue, a method (commonly referred to as the Frimpter method) was developed in early 1980’s to estimate probable high groundwater levels across the state. The USGS New England Water Science Center, in cooperation with the... - Data
- Multimedia
Stratified Sand
Stratified sand in an excavation near the Connecticut River in Portland, Connecticut. The sand was deposited as a delta in a glacial lake that occupied the Connecticut River Valley about 18,000-19,000 years ago.
Stratified sand in an excavation near the Connecticut River in Portland, Connecticut. The sand was deposited as a delta in a glacial lake that occupied the Connecticut River Valley about 18,000-19,000 years ago.
Groundwater Well in Mill Creek Basin in Cape Cod National SeashoreA Geoscientist-in-the-Park Guest Scientist for the National Park Service services a USGS groundwater well located within the Mill Creek basin near the Herring River in Wellfleet, Massachusetts.
A Geoscientist-in-the-Park Guest Scientist for the National Park Service services a USGS groundwater well located within the Mill Creek basin near the Herring River in Wellfleet, Massachusetts.
Tidal Water Moving through a Tide Control Structure in Wellfleet, MassachusettsA gage on the backside of a tide control structure on the Herring River at Chequessett Neck Rd at Wellfleet, Massachusetts. It is evident to see the movement of incoming tide in this picture. Data was collected at this site for several years prior to the removal of the dike in 2023.
A gage on the backside of a tide control structure on the Herring River at Chequessett Neck Rd at Wellfleet, Massachusetts. It is evident to see the movement of incoming tide in this picture. Data was collected at this site for several years prior to the removal of the dike in 2023.
Cape Cod National SeashoreA look to the north along the bluffs at the Cape Cod National Seashore, from Marconi Station. Over the years, the USGS continues to work with the National Park Service at the Cape Cod National Seashore.
A look to the north along the bluffs at the Cape Cod National Seashore, from Marconi Station. Over the years, the USGS continues to work with the National Park Service at the Cape Cod National Seashore.
Storm-tide sensor installation before Hurricane SandyHydrologic technician installs a storm-tide sensor ahead of Hurricane Sandy in Milford Harbor, Connecticut.
Hydrologic technician installs a storm-tide sensor ahead of Hurricane Sandy in Milford Harbor, Connecticut.
Storm surge sensor deployment on the Saugatuck RiverUSGS hydrologist holding a dry erase board to identify the storm surge sensor location deployment on August 27, 2011. The sensor is strapped to the back of a dock piling on the Saugatuck River in Westport, CT owned by the Saugatuck River Rowing Club.
USGS hydrologist holding a dry erase board to identify the storm surge sensor location deployment on August 27, 2011. The sensor is strapped to the back of a dock piling on the Saugatuck River in Westport, CT owned by the Saugatuck River Rowing Club.
Storm surge sensor deployment on the Housatonic RiverUSGS hydrologist pointing to the location of a storm surge sensor deployment near the mouth of the Housatonic River in Stratford, CT at the Sikorsky aircraft facility on August 27, 2011.
USGS hydrologist pointing to the location of a storm surge sensor deployment near the mouth of the Housatonic River in Stratford, CT at the Sikorsky aircraft facility on August 27, 2011.
- Publications
- Web Tools
- News
*Disclaimer: Listing outside positions with professional scientific organizations on this Staff Profile are for informational purposes only and do not constitute an endorsement of those professional scientific organizations or their activities by the USGS, Department of the Interior, or U.S. Government