
U.S. Geological Survey, Caribbean Florida Water Science Center main office, located in 10770 N 46th St, Tampa, FL 33617.
Images
Images from the Southeast Region.
Filter Total Items: 394

U.S. Geological Survey, Caribbean Florida Water Science Center office
U.S. Geological Survey, Caribbean Florida Water Science Center main office, located in 10770 N 46th St, Tampa, FL 33617.

Lepidoptera flier.JPG
Mail in deceased butterflies, moths, and skippers and help United States Geological Survey(USGS) scientists establish a Lepidoptera Research Collection (LRC). Specimens will help USGS scientists identify contaminants and environmental factors which may be contributing to the decline of insect populations.
Mail in deceased butterflies, moths, and skippers and help United States Geological Survey(USGS) scientists establish a Lepidoptera Research Collection (LRC). Specimens will help USGS scientists identify contaminants and environmental factors which may be contributing to the decline of insect populations.

High water in the Walnut Creek watershed
High water in the Walnut Creek watershed in Raleigh, North Carolina, in 2022. Flooding can impact nearby infrastructure, including homes, businesses, roads and trails. Credit: Kristina Hopkins, USGS.
High water in the Walnut Creek watershed in Raleigh, North Carolina, in 2022. Flooding can impact nearby infrastructure, including homes, businesses, roads and trails. Credit: Kristina Hopkins, USGS.

Black Carp Observations in the Mississippi River Basin
A map of black carp observations in the Mississippi River basin reported to the USGS Nonindigenous Aquatic Species database as of November 30, 2022. This map is not a complete representation of species abundance or distribution. These data include incidental captures by the public and reports from federal and state agencies.
A map of black carp observations in the Mississippi River basin reported to the USGS Nonindigenous Aquatic Species database as of November 30, 2022. This map is not a complete representation of species abundance or distribution. These data include incidental captures by the public and reports from federal and state agencies.

Legna Torres-Garcia with oceanographic instrumentation
Legna Torres-Garcia deploys oceanographic instrumentation to measure waves, currents, water temperature and water levels in Dorado, Puerto Rico in October 2022. This deployment will improve computer model accuracy related to total water level forecast. USGS Photo by David Thompson.
Legna Torres-Garcia deploys oceanographic instrumentation to measure waves, currents, water temperature and water levels in Dorado, Puerto Rico in October 2022. This deployment will improve computer model accuracy related to total water level forecast. USGS Photo by David Thompson.

USGS Science After Hurricane Ian
After Hurricane Ian, USGS scientist Scott Greenwood services the USGS streamgage on the St. Johns River near Sanford, Florida. Photograph taken October 6, 2022. Credit: Gene Grimm, USGS.
After Hurricane Ian, USGS scientist Scott Greenwood services the USGS streamgage on the St. Johns River near Sanford, Florida. Photograph taken October 6, 2022. Credit: Gene Grimm, USGS.

USGS Science After Hurricane Ian
After Hurricane Ian, USGS safety and occupational health specialist Sean Raabe retrieves a USGS storm surge sensor at Fernandina Beach, Florida. Photograph taken October 5, 2022. Credit: Hannah Flynn, USGS.
After Hurricane Ian, USGS safety and occupational health specialist Sean Raabe retrieves a USGS storm surge sensor at Fernandina Beach, Florida. Photograph taken October 5, 2022. Credit: Hannah Flynn, USGS.

USGS Science After Hurricane Ian
USGS hydrologic technician Megan Bock surveys high water marks from Hurricane Ian in Marineland, Florida. Photograph taken October 4, 2022. Credit: Fabian Kahn, USGS.
USGS hydrologic technician Megan Bock surveys high water marks from Hurricane Ian in Marineland, Florida. Photograph taken October 4, 2022. Credit: Fabian Kahn, USGS.

USGS Science After Hurricane Ian
USGS hydrologic technician Emily Robinson documents high water marks from Hurricane Ian on a house near Buckingham, Florida. Photograph taken October 2, 2022. Credit: Roberto Ravelo, USGS.
USGS hydrologic technician Emily Robinson documents high water marks from Hurricane Ian on a house near Buckingham, Florida. Photograph taken October 2, 2022. Credit: Roberto Ravelo, USGS.

USGS Science After Hurricane Ian
USGS safety and occupational health specialist Sean Raabe verifies the elevation of a USGS water level sensor in New Smyrna Beach, Florida. Photograph taken October 2, 2022. Credit: Hannah Flynn, USGS.
USGS safety and occupational health specialist Sean Raabe verifies the elevation of a USGS water level sensor in New Smyrna Beach, Florida. Photograph taken October 2, 2022. Credit: Hannah Flynn, USGS.

Installing Storm-tide Sensors for Hurricane Ian
Lukas Medo, a USGS hydrologic technician, installs a water-level sensor in Levy County, Florida, September 26, ahead of Hurricane Ian's landfall. Photo by Patrick Marasco, USGS.
Lukas Medo, a USGS hydrologic technician, installs a water-level sensor in Levy County, Florida, September 26, ahead of Hurricane Ian's landfall. Photo by Patrick Marasco, USGS.

Tres científicos del USGS que instalan equipos submarinos
Tres científicos del Servicio Geológico de los Estados Unidos en equipo de buceo instalando una boya de olas y un sensor de presión a 60 pies de profundad para medir las olas y niveles de agua en Isla Verde, Puerto Rico.
Tres científicos del Servicio Geológico de los Estados Unidos en equipo de buceo instalando una boya de olas y un sensor de presión a 60 pies de profundad para medir las olas y niveles de agua en Isla Verde, Puerto Rico.
USGS scientists installing underwater equipment
Three U.S. Geological Survey scientists in scuba gear work to install a wave buoy and pressure sensor 60 feet underwater to measure waves and water levels in Isla Verde, Puerto Rico.
Three U.S. Geological Survey scientists in scuba gear work to install a wave buoy and pressure sensor 60 feet underwater to measure waves and water levels in Isla Verde, Puerto Rico.

Dos científicos del Servicio Geológico de los Estados Unidos instalando un equipo para sondeos de una costa
linkDos científicos del Servicio Geológico de los Estados Unidos instalando un equipo para sondeos de una costa en Dorado, Puerto Rico. Este equipo monitoreará como la playa y la línea costera cambian a través del tiempo. Imagen de USGS.
USGS scientists set-up equipment on beach
Two U.S. Geological Survey scientists set-up equipment to survey a beach in Dorado, Puerto Rico. This equipment will monitor how the beach and shoreline change through time. USGS Image.
Two U.S. Geological Survey scientists set-up equipment to survey a beach in Dorado, Puerto Rico. This equipment will monitor how the beach and shoreline change through time. USGS Image.
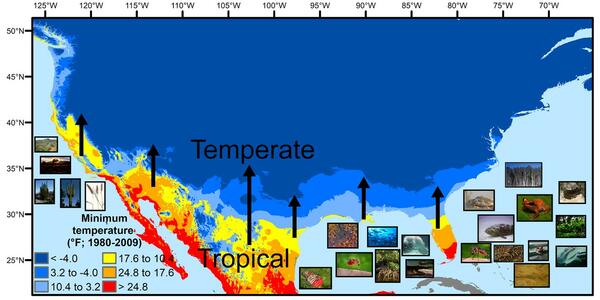
U.S. regions in the tropical-to-temperate transition
A map showing North America's tropical-to-temperate transition zone. Red, orange, and yellow depict the more tropical zones, and blues depict the more temperate zones, based on to the coldest recorded temperature for each area between 1980 and 2009.
A map showing North America's tropical-to-temperate transition zone. Red, orange, and yellow depict the more tropical zones, and blues depict the more temperate zones, based on to the coldest recorded temperature for each area between 1980 and 2009.
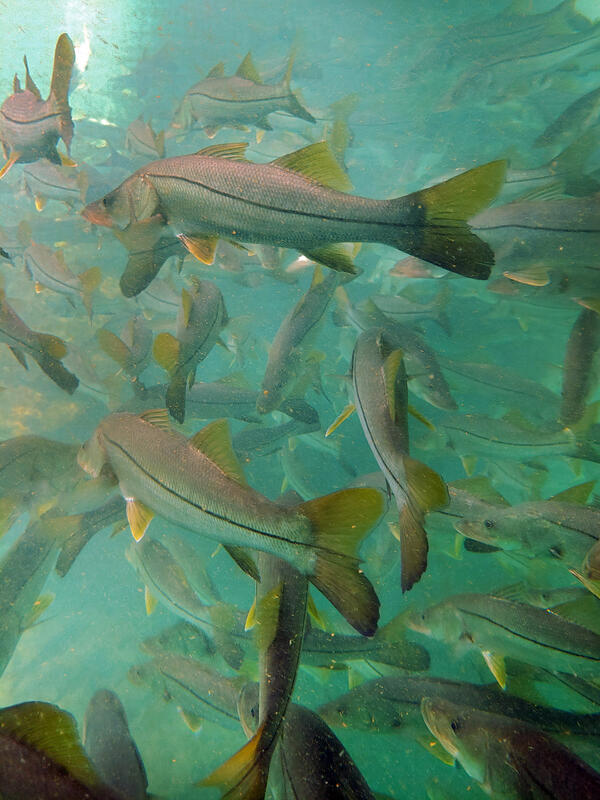
Subtropical snook gather at a warm Florida springhead in winter
Winter temperature extremes control the distributions of subtropical fishes. Common snook (Centropomus undecimalis), aggregate at a spring in northern Florida during winter. Snook are warm saltwater game fish, common in Florida, that have been moving further northward as extreme cold spells become less frequent and less intense.
Winter temperature extremes control the distributions of subtropical fishes. Common snook (Centropomus undecimalis), aggregate at a spring in northern Florida during winter. Snook are warm saltwater game fish, common in Florida, that have been moving further northward as extreme cold spells become less frequent and less intense.

Winter landscape at Lake Placid
Photo Contest Winner | January 2021 | USGS at Work
Winter Wonderland in Lake Placid, NY
Photo Contest Winner | January 2021 | USGS at Work
Winter Wonderland in Lake Placid, NY

Ellis River New Hampshire
Photo Contest Winner | January 2021 | Where We Work
Ellis River, New Hampshire
Photo Contest Winner | January 2021 | Where We Work
Ellis River, New Hampshire