
Geology of the unconformity on Mount Everts in Yellowstone National Park. Sketch at the top was made by geologist William Henry Holmes in 1878 and correctly identifies Cretaceous sediments overlain by much younger rhyolite rocks, including fine ash deposits (“tufa”). The photo at the bottom shows the same outcrop as viewed from Mammoth Hot Springs (USGS
Images
Images of Yellowstone.
Filter Total Items: 446

Geology of the unconformity on Mount Everts in Yellowstone National Park
Geology of the unconformity on Mount Everts in Yellowstone National Park. Sketch at the top was made by geologist William Henry Holmes in 1878 and correctly identifies Cretaceous sediments overlain by much younger rhyolite rocks, including fine ash deposits (“tufa”). The photo at the bottom shows the same outcrop as viewed from Mammoth Hot Springs (USGS

Pie diagram showing chloride flux measured in 2022 in rivers of Yellowstone National Park
Pie diagram showing the chloride flux, in kilotons per year (kt/yr), measured in 2022, with percentages for the four major rivers (Madison, Yellowstone, Snake, and Falls rivers) that drain Yellowstone National Park. Figure developed by Baine McCleskey.
Pie diagram showing the chloride flux, in kilotons per year (kt/yr), measured in 2022, with percentages for the four major rivers (Madison, Yellowstone, Snake, and Falls rivers) that drain Yellowstone National Park. Figure developed by Baine McCleskey.

Images of an unnamed thermal feature in the Three River Junction thermal area in southwest Yellowstone National Park
linkImages of an unnamed thermal feature in the Three River Junction thermal area in southwest Yellowstone National Park. A, WorldView-3 satellite image from September 2014. B, National Park Service (NPS) aerial photograph from 2017. Images A and B were acquired before the feature went largely dry in late 2019 or 2020. C, WorldView-3 satellite image from June 2020.

3D rendering of the shear-wave-speed anomaly below Yellowstone
3D rendering of the shear-wave-speed anomaly (ɗVS) below Yellowstone. Regions of strongly reduced shear-wave speed most likely indicate volumes of partially molten crust. Iso-surfaces (surfaces of constant ɗVS) are shown in increments of 5%.
3D rendering of the shear-wave-speed anomaly (ɗVS) below Yellowstone. Regions of strongly reduced shear-wave speed most likely indicate volumes of partially molten crust. Iso-surfaces (surfaces of constant ɗVS) are shown in increments of 5%.

Seismic data coverage of the Yellowstone region and example of seismic noise records
Seismic data coverage of the Yellowstone region and example of seismic noise records. By cross-correlating signals of the background noise recorded at two seismic stations and stacking the signals over many days, useful seismic waveforms can be extracted.
Seismic data coverage of the Yellowstone region and example of seismic noise records. By cross-correlating signals of the background noise recorded at two seismic stations and stacking the signals over many days, useful seismic waveforms can be extracted.

Seismicity in the Yellowstone region during 2022
Map of seismicity (red circles) in the Yellowstone region during 2022. Gray lines are roads, black dashed line shows the caldera boundary, Yellowstone National Park is outlined by black dot-dashed line, and gray dashed lines denote state boundaries.
Map of seismicity (red circles) in the Yellowstone region during 2022. Gray lines are roads, black dashed line shows the caldera boundary, Yellowstone National Park is outlined by black dot-dashed line, and gray dashed lines denote state boundaries.

Google Earth image of the north part of Lower Geyser Basin, Yellowstone National Park, showing the site of the Fountain Hotel
linkGoogle Earth image of the north part of Lower Geyser Basin showing the site of the Fountain Hotel and nearby Leather Pool, which was tapped to provide a source of hot water for the hotel.

Discharge and specific conductance measured in June 2022 at the Gardner River, Yellowstone National Park
linkGraph showing the discharge (blue) and specific conductance (black) measured at the Gardner River monitoring station in Yellowstone National Park during the June 10–13, 2022, flood.
Discharge and specific conductance measured in June 2022 at the Gardner River, Yellowstone National Park
linkGraph showing the discharge (blue) and specific conductance (black) measured at the Gardner River monitoring station in Yellowstone National Park during the June 10–13, 2022, flood.

Map of southern Idaho and the Snake River Plain
Map of southern Idaho and the Snake River Plain, showing the eastern (ESRP) and western (WSRP) parts of the geologic province. Map by Zach Lifton, Idaho Geological Survey.
Map of southern Idaho and the Snake River Plain, showing the eastern (ESRP) and western (WSRP) parts of the geologic province. Map by Zach Lifton, Idaho Geological Survey.

Jamie Farrell presents Yellowstone as one of the first 100 IUGS Geological Heritage Sites
Jamie Farrell presents Yellowstone as one of the first 100 IUGS Geological Heritage Sites during the 60th anniversary IUGS meeting in Zumaia, Spain in October, 2022. Photo by Marjorie Chan.
Jamie Farrell presents Yellowstone as one of the first 100 IUGS Geological Heritage Sites during the 60th anniversary IUGS meeting in Zumaia, Spain in October, 2022. Photo by Marjorie Chan.

Certificate for Yellowstone as one of the first 100 IUGS Geological Heritage Sites
Document certifying The Yellowstone Volcanic and Hydrothermal System, USA, as one of the first 100 IUGS Geological Heritage Sites as declared during the 60th anniversary IUGS meeting held in Zumaia, Spain in October 2022.
Document certifying The Yellowstone Volcanic and Hydrothermal System, USA, as one of the first 100 IUGS Geological Heritage Sites as declared during the 60th anniversary IUGS meeting held in Zumaia, Spain in October 2022.

Yellowstone interferogram from Sentinel-1 spanning September 29, 2021, to October 6, 2022
Interferogram created from data collected on September 29, 2021, and October 6, 2022, by the Sentinel-1 satellite system. Colored fringes indicate a change in distance (called range change) between the satellite and ground surface that is caused by surface deformation.
Interferogram created from data collected on September 29, 2021, and October 6, 2022, by the Sentinel-1 satellite system. Colored fringes indicate a change in distance (called range change) between the satellite and ground surface that is caused by surface deformation.

Atmospheric water vapor and river level during June 2022 in the NE part of Yellowstone National Park
linkAtmospheric water vapor and river level measured during June 2022 in the northeast part of Yellowstone National Park. Gray line is the level of the Lamar River. Blue line is the amount of water vapor in the atmosphere above GPS station P720.

Cutbank exposure near West DuNoir Creek, Wyoming
A cutbank exposure near West DuNoir Creek, Wyoming, illustrates the differences between bedrock and surficial geologic mapping. On bedrock maps this location is mapped as the Eocene (55–34 million years old) Indian Meadows Formation, which corresponds to the bedrock visible in the stream bed.
A cutbank exposure near West DuNoir Creek, Wyoming, illustrates the differences between bedrock and surficial geologic mapping. On bedrock maps this location is mapped as the Eocene (55–34 million years old) Indian Meadows Formation, which corresponds to the bedrock visible in the stream bed.

Photo of a newly eroded cliff along the Gardner River, Yellowstone National Park
Photo of a newly eroded cliff along the Gardner River, Yellowstone National Park, showing the unconsolidated layers of sandstone and gravel. USGS photo by David Roth, September 5, 2022.
Photo of a newly eroded cliff along the Gardner River, Yellowstone National Park, showing the unconsolidated layers of sandstone and gravel. USGS photo by David Roth, September 5, 2022.

Method of rapidly cooling an experiment that involves molten rock
One method of rapidly cooling an experiment that involves molten rock. The volcanic material is dropped from inside the furnace (at ~1000 °C or 1830 °F!) down a vertical tube and into a bulb of room-temperature water.
One method of rapidly cooling an experiment that involves molten rock. The volcanic material is dropped from inside the furnace (at ~1000 °C or 1830 °F!) down a vertical tube and into a bulb of room-temperature water.

Sediment cores from Twin Butte Lake, Yellowstone National Park, being analyzed in the laboratory
linkSediment cores from Twin Butte Lake, Yellowstone National Park, being analyzed in the laboratory. (a) Photo of a freshly split core that exhibits a transition in lake productivity (grey sediment on bottom to dark organic rich sediment on top). One half of the core is scanned for multiple types of data and sampled while the other half of the core is archived.

Gardner River chloride flux monitoring site before and after the June 2022 flooding in Yellowstone National Park
linkGardner River chloride flux monitoring site before and after the June 2022 flooding in Yellowstone National Park. (Left) Site prior to June 2022 storm. Note that the riverbank is near to the base of the fallen tree. USGS photo by Blaine McCleskey, May 21, 2014. (Right) Site after June 2022 storm. The probe is buried under ~4 feet of debris.

Landsat 8 thermal infrared images of Yellowstone showing daily and seasonal differences.
Landsat 8 thermal infrared images of Yellowstone showing daily and seasonal differences. In these greyscale images, bright pixels are warmer and dark pixels are cooler. In the daytime images (A and C), you can see the effects of topography, with darker (cooler) pixels like shadows on north-facing slopes and brighter (warmer) pixels on sun-facing slopes.&
Landsat 8 thermal infrared images of Yellowstone showing daily and seasonal differences. In these greyscale images, bright pixels are warmer and dark pixels are cooler. In the daytime images (A and C), you can see the effects of topography, with darker (cooler) pixels like shadows on north-facing slopes and brighter (warmer) pixels on sun-facing slopes.&

Dr. Cathy Whitlock on Twin Butte Lake, Yellowstone National Park, with a freshly extruded sediment core
linkDr. Cathy Whitlock (Montana State University) in the “core description boat” on Twin Butte Lake, Yellowstone National Park, with a freshly extruded one meter (3 feet) sediment core. Cores are described and measured in the field before being carefully wrapped for transport to the lab. Photo taken under NPS research permit YELL-2022-SCI-0009 by S.
Pack mules carrying lake coring equipment to a small backcountry lake in Yellowstone National Park
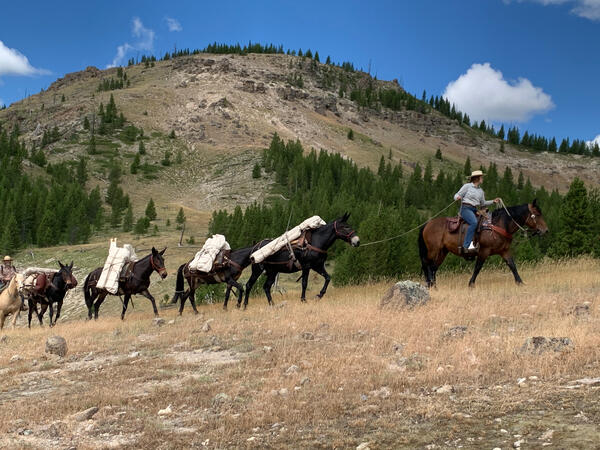
linkA string of pack mules led by the National Park Service packers Hannah Miller and Ben Cunningham carrying lake coring equipment to a small backcountry lake in Yellowstone National Park; photo taken under NPS research permit YELL-2022-SCI-0009 by S. Hurwitz in August 2022.
Pack mules carrying lake coring equipment to a small backcountry lake in Yellowstone National Park
linkA string of pack mules led by the National Park Service packers Hannah Miller and Ben Cunningham carrying lake coring equipment to a small backcountry lake in Yellowstone National Park; photo taken under NPS research permit YELL-2022-SCI-0009 by S. Hurwitz in August 2022.