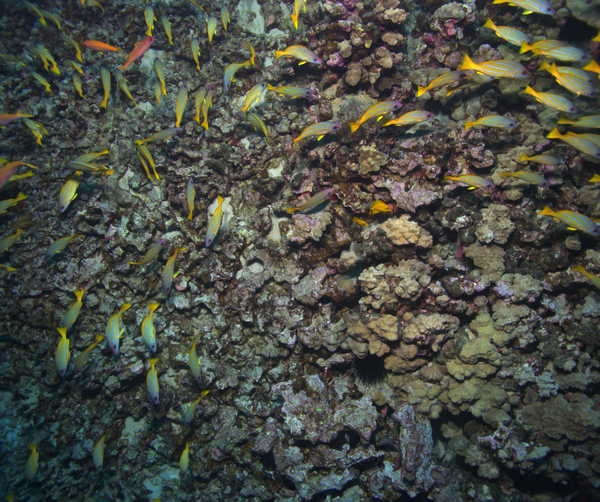
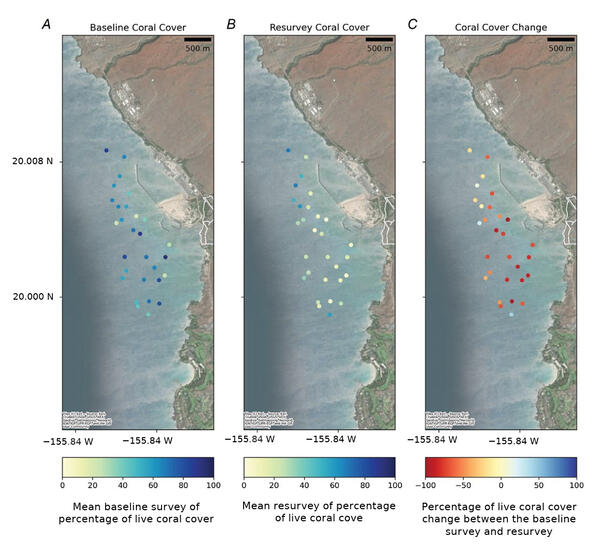
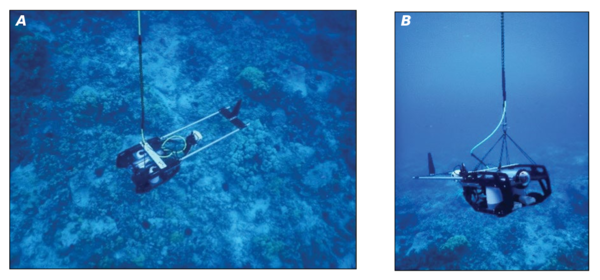
U.S. flag

An official website of the United States government

Multimedia

Images

Predictions of 100-year storm surge return levels and associated 90% credible interval widths for the entire US coastline
BAYEX predictions of 100-year storm surge return levels and associated 90% credible interval widths for the entire US coastline
Collage showing three different coastlines
Banner image for Coastal Science Navigator

Banner image for the Coastal Science Navigator, an online gateway for users such as state and local planners, resources managers, consultants, and researchers to more easily gain access to USGS coastal science data, products, tools, and information.

Banner image for the Coastal Science Navigator, an online gateway for users such as state and local planners, resources managers, consultants, and researchers to more easily gain access to USGS coastal science data, products, tools, and information.

Aerial photo of Pacific Missile Range Facility-Barking Sands in Hawai'i
Pacific Missile Range Facility-Barking Sands in Hawai'i

Pacific Missile Range Facility-Barking Sands in Hawai'i, operated by the U.S. Department of Defense.

Charts depicting water flux through a tidal creek during flood and ebb tides

Water flux through a tidal creek with a small, moderate, and extreme tide range during (A) a flood tide and (B) an ebb tide. Creek velocity legend applies to all tide ranges.

Water flux through a tidal creek with a small, moderate, and extreme tide range during (A) a flood tide and (B) an ebb tide. Creek velocity legend applies to all tide ranges.

Maps showing China Camp Marsh study area with inset showing suspended sediment measurements

Map of study area: China Camp State Park and the adjacent shallows of San Pablo Bay. Black and gray bathymetry lines indicate the location of mean higher high water (MHHW) and mean lower low water (MLLW), respectively. Elevations in meters of those tidal datums are referenced to the North American Vertical Datum of 1988

Map of study area: China Camp State Park and the adjacent shallows of San Pablo Bay. Black and gray bathymetry lines indicate the location of mean higher high water (MHHW) and mean lower low water (MLLW), respectively. Elevations in meters of those tidal datums are referenced to the North American Vertical Datum of 1988

Map of the North American West Coast with charts showing hydrodynamic forcings and beach morphology states
Study area overview with hydrodynamic forcings and beach morphology states

Map of the North American West Coast, the monitored coastline is shown in light yellow. Dashed boxes delineate the different subregions of the study area. Pie charts show the regional distribution of advancing/retreating waterline trends during 2000–2022 derived from the dataset presented in this study.

Map of the North American West Coast, the monitored coastline is shown in light yellow. Dashed boxes delineate the different subregions of the study area. Pie charts show the regional distribution of advancing/retreating waterline trends during 2000–2022 derived from the dataset presented in this study.

Videos

Cover image for the video "USGS Coastal and Marine Field Operations" showing montage of fieldwork USGS Coastal and Marine Field Operations
USGS Coastal and Marine Field Operations

To conduct the science needed to understand coastal and marine geohazards, support habitat and resource management, and monitor how these environments change over time, the USGS Coastal and Marine Hazards and Resources Program relies on engineering, mechanical, and electronics expertise for field operations along the coast, in the nearshore environment, and in the d

To conduct the science needed to understand coastal and marine geohazards, support habitat and resource management, and monitor how these environments change over time, the USGS Coastal and Marine Hazards and Resources Program relies on engineering, mechanical, and electronics expertise for field operations along the coast, in the nearshore environment, and in the d

Image of a deep-sea sulfide mound at Escanaba Trough with the text "Characterizing organic carbon at Escanaba Trough" Characterizing organic carbon at Escanaba Trough
Characterizing organic carbon at Escanaba Trough

The global ocean is a significant carbon sink, absorbing about a third of all atmospheric carbon dioxide (CO2) emissions (Gruber et al., 2019).

Image of a deep-sea sulfide mound at Escanaba Trough with the text "Characterizing organic carbon at Escanaba Trough" Characterizing organic carbon at Escanaba Trough (AD)
Characterizing organic carbon at Escanaba Trough (AD)

The global ocean is a significant carbon sink, absorbing about a third of all atmospheric carbon dioxide (CO2) emissions (Gruber et al., 2019).

Aerial image of a California beach with text reading "Shoreline Seasonality of California's Beaches" Shoreline Seasonality of California's Beaches
Shoreline Seasonality of California's Beaches

Most of the world’s beaches have regular cycles of erosion and recovery, but new USGS research is showing that these cycles may be considerably different from common perceptions. 

Most of the world’s beaches have regular cycles of erosion and recovery, but new USGS research is showing that these cycles may be considerably different from common perceptions. 

Aerial image of a California beach with text reading "Shoreline Seasonality of California's Beaches" Shoreline Seasonality of California's Beaches (AD)
Shoreline Seasonality of California's Beaches (AD)

Most of the world’s beaches have regular cycles of erosion and recovery, but new USGS research is showing that these cycles may be considerably different from common perceptions. 

Most of the world’s beaches have regular cycles of erosion and recovery, but new USGS research is showing that these cycles may be considerably different from common perceptions. 

Coral on a cinderblock and a scuba diver on a coral reef Hybrid coral reef restoration: A cost-effective, nature-based solution to protect people and property (AD)
Hybrid coral reef restoration: A cost-effective, nature-based solution to protect people and property (AD)

Coral reef restoration can protect hundreds of millions of dollars of coastal property and business activity annually from storm-driven flooding.

It can protect thousands of people, especially children, the elderly, minorities, and those below the poverty line. Thus, coral reef restoration is a mechanism to provide environmental equity.

Audio

Thumbnail image for Eyes on Earth Episode 120 – Mapping the California Coastline showing guest Sean Vitousek on a watercraft
Thumbnail image for EoE Episode 120 – Mapping the California Coastline
Eyes on Earth Episode 120 – Mapping the California Coastline
Thumbnail image for Eyes on Earth Episode 120 – Mapping the California Coastline showing guest Sean Vitousek on a watercraft
Thumbnail image for EoE Episode 120 – Mapping the California Coastline
Eyes on Earth Episode 120 – Mapping the California Coastline

In this episode of Eyes on Earth, we begin a series on Landsat’s usefulness in coastal studies. First, we talk with Sean Vitousek, a USGS research oceanographer, about changes to beaches in California and how he is using Landsat and other data to create models that can predict how the coastline may change in the future because of sea level rise and coastal erosion.

In this episode of Eyes on Earth, we begin a series on Landsat’s usefulness in coastal studies. First, we talk with Sean Vitousek, a USGS research oceanographer, about changes to beaches in California and how he is using Landsat and other data to create models that can predict how the coastline may change in the future because of sea level rise and coastal erosion.

Webcams

View of an Arctic beach area with gentle waters.
Nuvuk video camera 2 dark image

Two video cameras are installed atop a utility pole near the northernmost point of land in the United States at Nuvuk (Point Barrow), Alaska. The cameras point northwest toward the Arctic Ocean and the boundary between the Chukchi and Beaufort Seas. Every half hour during daylight hours, the cameras collect snapshots and video for 10 minutes.

Two video cameras are installed atop a utility pole near the northernmost point of land in the United States at Nuvuk (Point Barrow), Alaska. The cameras point northwest toward the Arctic Ocean and the boundary between the Chukchi and Beaufort Seas. Every half hour during daylight hours, the cameras collect snapshots and video for 10 minutes.

View of an Arctic beach area with gentle waters.
Nuvuk video camera 1 dark image

Two video cameras are installed atop a utility pole near the northernmost point of land in the United States at Nuvuk (Point Barrow), Alaska. The cameras point northwest toward the Arctic Ocean and the boundary between the Chukchi and Beaufort Seas. Every half hour during daylight hours, the cameras collect snapshots and video for 10 minutes.

Two video cameras are installed atop a utility pole near the northernmost point of land in the United States at Nuvuk (Point Barrow), Alaska. The cameras point northwest toward the Arctic Ocean and the boundary between the Chukchi and Beaufort Seas. Every half hour during daylight hours, the cameras collect snapshots and video for 10 minutes.

View of an Arctic beach area with gentle waters.
Nuvuk video camera 2 bright image

Two video cameras are installed atop a utility pole near the northernmost point of land in the United States at Nuvuk (Point Barrow), Alaska. The cameras point northwest toward the Arctic Ocean and the boundary between the Chukchi and Beaufort Seas. Every half hour during daylight hours, the cameras collect snapshots and video for 10 minutes.

Two video cameras are installed atop a utility pole near the northernmost point of land in the United States at Nuvuk (Point Barrow), Alaska. The cameras point northwest toward the Arctic Ocean and the boundary between the Chukchi and Beaufort Seas. Every half hour during daylight hours, the cameras collect snapshots and video for 10 minutes.

View of an Arctic beach area with gentle waters.
Nuvuk video camera 2 variance image

Two video cameras are installed atop a utility pole near the northernmost point of land in the United States at Nuvuk (Point Barrow), Alaska. The cameras point northwest toward the Arctic Ocean and the boundary between the Chukchi and Beaufort Seas. Every half hour during daylight hours, the cameras collect snapshots and video for 10 minutes.

Two video cameras are installed atop a utility pole near the northernmost point of land in the United States at Nuvuk (Point Barrow), Alaska. The cameras point northwest toward the Arctic Ocean and the boundary between the Chukchi and Beaufort Seas. Every half hour during daylight hours, the cameras collect snapshots and video for 10 minutes.

View of an Arctic beach area with gentle waters.
Nuvuk video camera 1 time exposure

Two video cameras are installed atop a utility pole near the northernmost point of land in the United States at Nuvuk (Point Barrow), Alaska. The cameras point northwest toward the Arctic Ocean and the boundary between the Chukchi and Beaufort Seas. Every half hour during daylight hours, the cameras collect snapshots and video for 10 minutes.

Two video cameras are installed atop a utility pole near the northernmost point of land in the United States at Nuvuk (Point Barrow), Alaska. The cameras point northwest toward the Arctic Ocean and the boundary between the Chukchi and Beaufort Seas. Every half hour during daylight hours, the cameras collect snapshots and video for 10 minutes.

View of an Arctic beach area with gentle waters.
Nuvuk video camera 2 snapshop

Two video cameras are installed atop a utility pole near the northernmost point of land in the United States at Nuvuk (Point Barrow), Alaska. The cameras point northwest toward the Arctic Ocean and the boundary between the Chukchi and Beaufort Seas. Every half hour during daylight hours, the cameras collect snapshots and video for 10 minutes.

Two video cameras are installed atop a utility pole near the northernmost point of land in the United States at Nuvuk (Point Barrow), Alaska. The cameras point northwest toward the Arctic Ocean and the boundary between the Chukchi and Beaufort Seas. Every half hour during daylight hours, the cameras collect snapshots and video for 10 minutes.

Was this page helpful?