
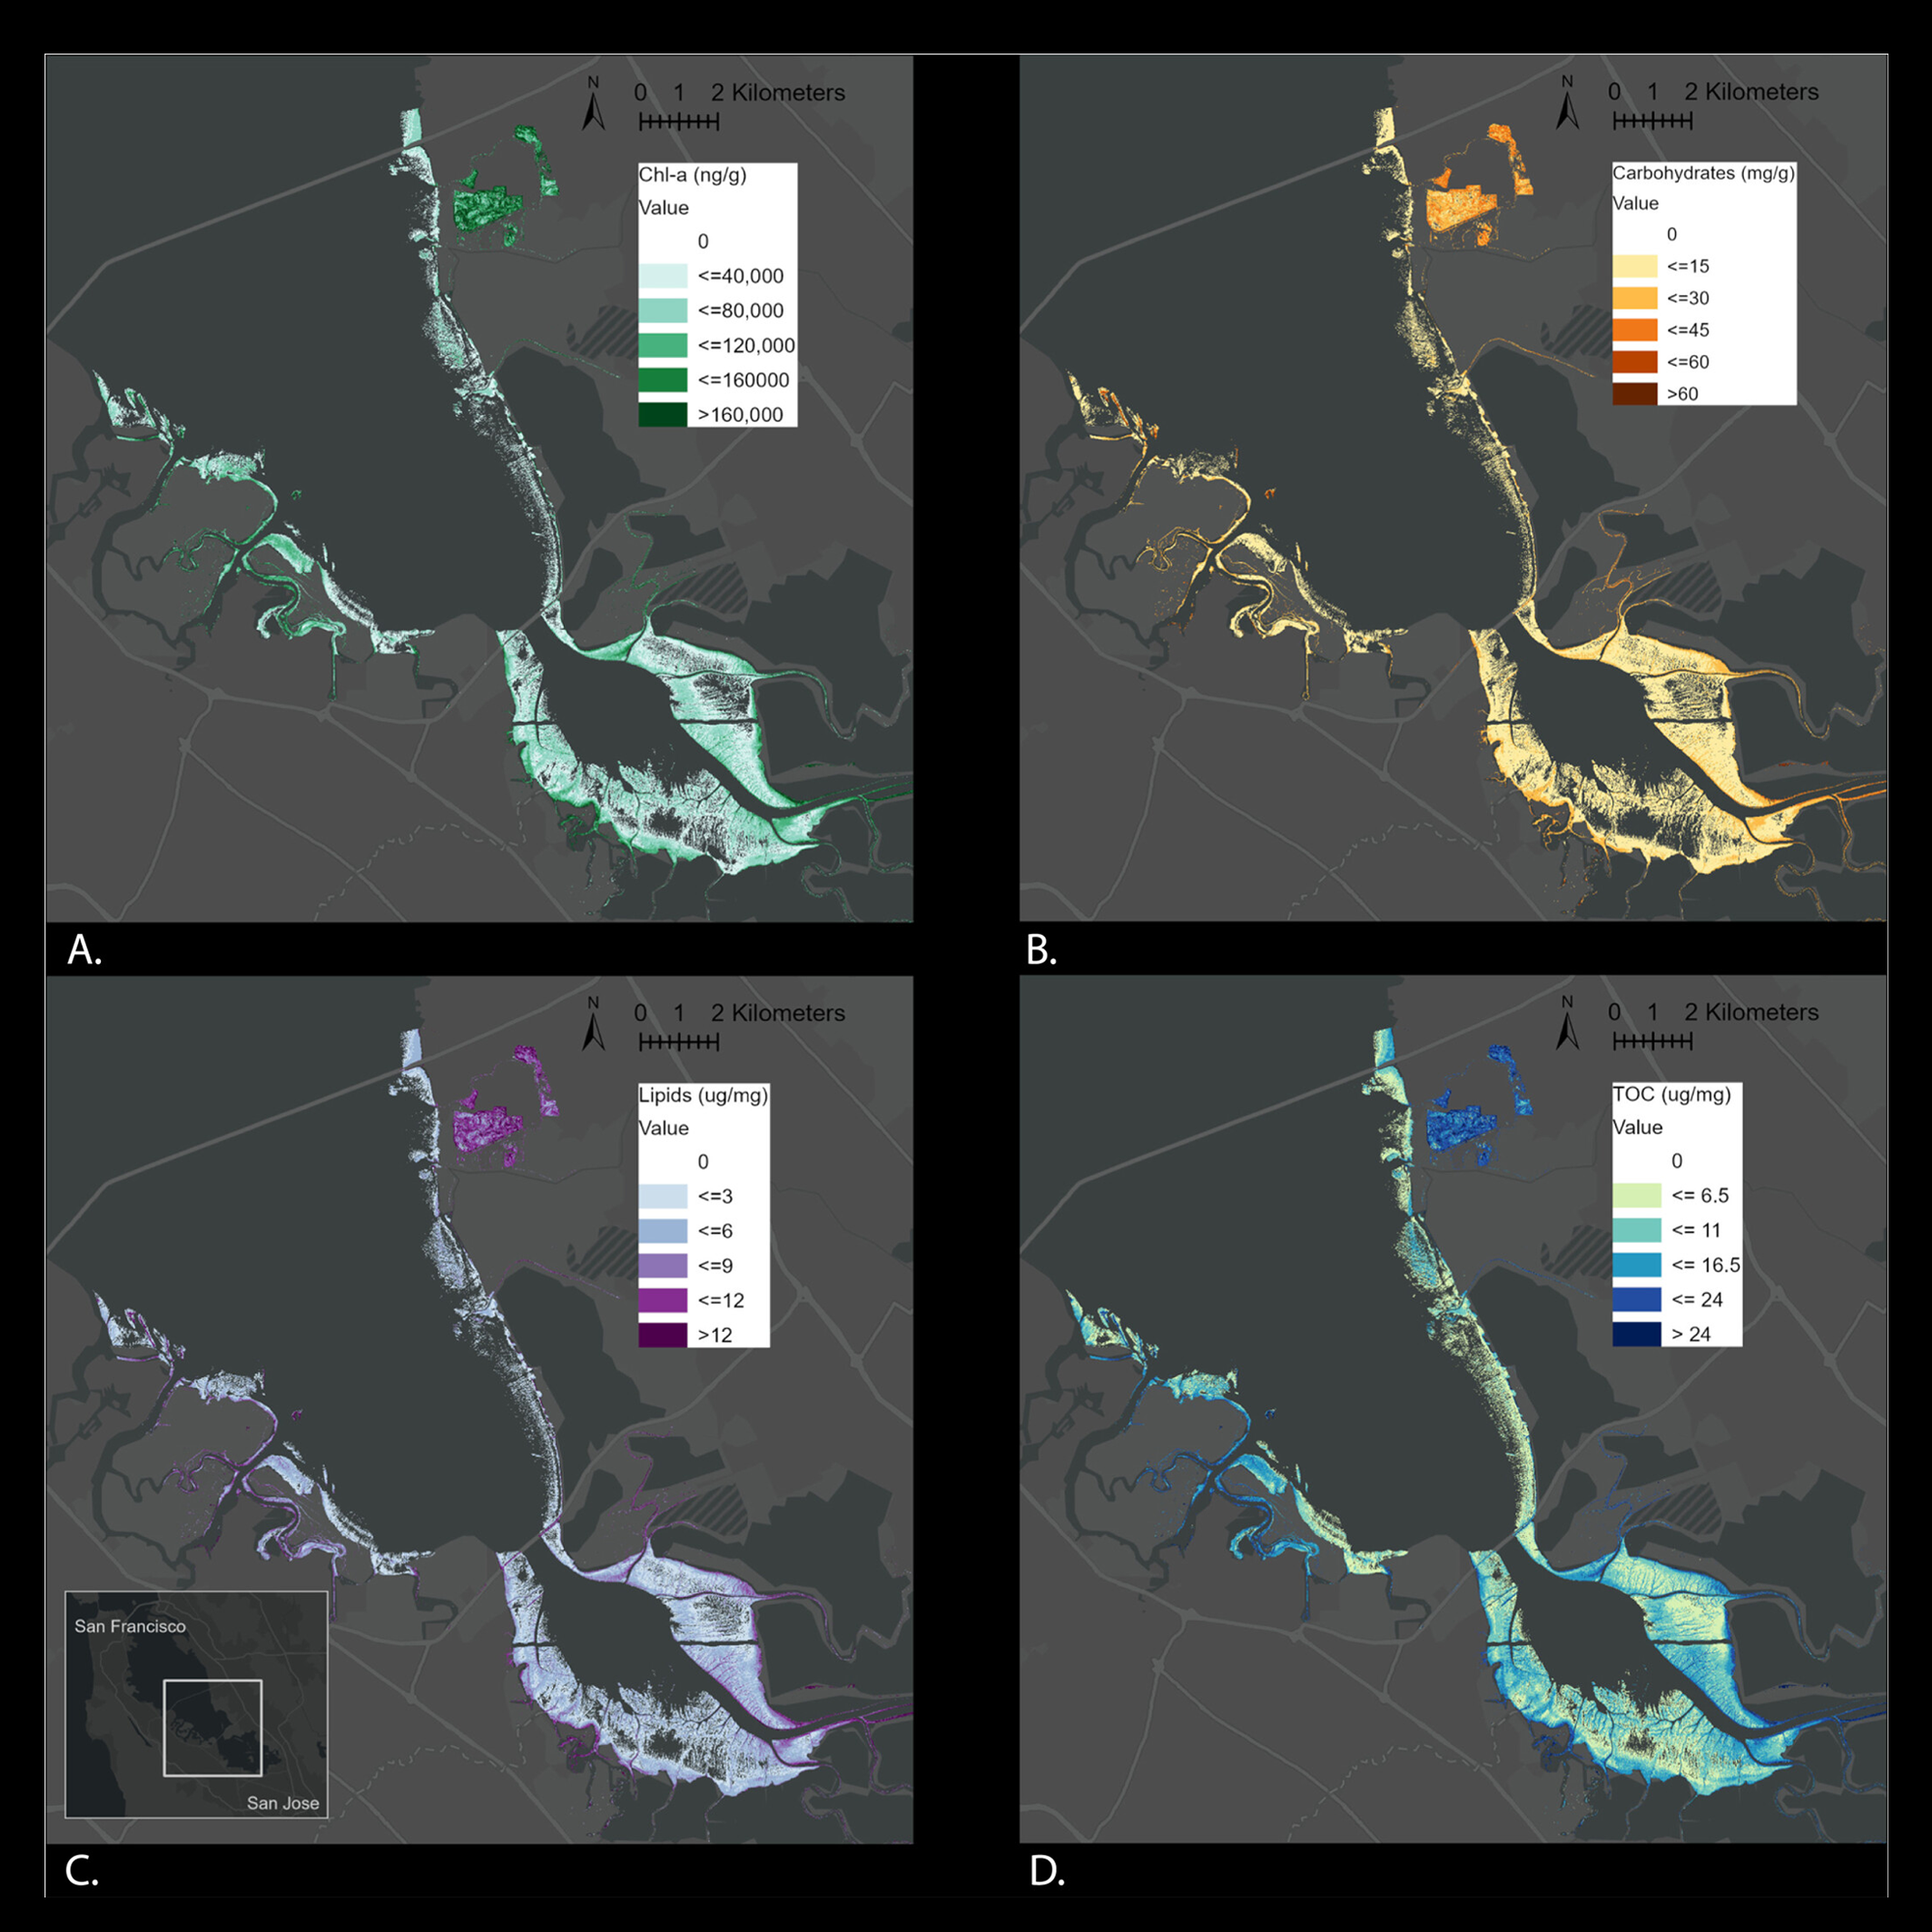
Maps of chlorophyll-a concentration, carbohydrates, lipids, and total organic carbon in southern San Francisco Bay

Detailed Description
Maps of (a) chl-a concentration, (b) carbohydrates, (c) lipids, and (d) total organic carbon in southern San Francisco Bay, 15 April 2021, based on final partial least squares regression models and AVIRIS-NG 3.7 m imagery. Base map from Esri and its licensors, copyright 2022. From the study Multi-Scale Spectroscopy to Map Intertidal Microbial Biofilm Community and Trait Diversity.
Sources/Usage
Public Domain.