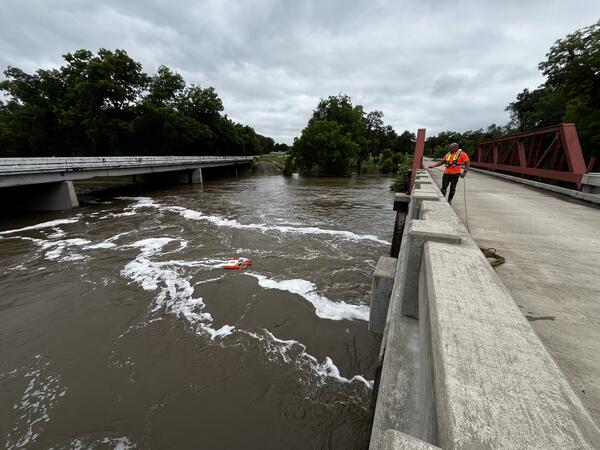
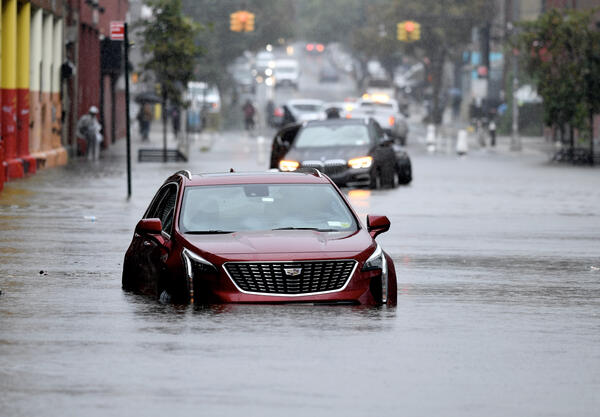
Flood predictions require several types of data:
- The amount of rainfall occurring on a real-time basis.
- The rate of change in river stage on a real-time basis, which can help indicate the severity and immediacy of the threat.
- Knowledge about the type of storm producing the moisture, such as duration, intensity and areal extent, which can be valuable for determining possible severity of the flooding.
- Knowledge about the characteristics of a river's drainage basin, such as soil-moisture conditions, ground temperature, snowpack, topography, vegetation cover, and impermeable land area, which can help to predict how extensive and damaging a flood might become.
The National Weather Service (an agency within NOAA) collects and interprets rainfall data throughout the United States and issues flood watches and warnings as appropriate. They use statistical models that incorporate USGS streamflow data to try to predict the results of expected storms. See their Advanced Hydrologic Prediction Service River Forecasts and Long-Range River Flood Risk webpages.
The USGS maintains a network of streamflow-gaging stations throughout the country.
Related Content
What are the two types of floods?
There are two basic types of floods: flash floods and the more widespread river floods. Flash floods generally cause greater loss of life and river floods generally cause greater loss of property. A flash flood occurs when runoff from excessive rainfall causes a rapid rise in the water height (stage) of a stream or normally-dry channel. Flash floods are more common in areas with a dry climate and...
Does an increase in the 100-year flood estimate originate from climate or land-use change?
Climate variability (dry cycles to wet cycles) and land-use change play a significant role, but there is a large amount of uncertainty around the flood quantile estimates (the value of discharge corresponding to the 100-year flood), particularly if there isn’t a long record of observed data at a stream location. Learn more: The 100-Year Flood The 100-Year Flood--It's All About Chance
How can a 1,000-year rainfall not result in a 1,000-year flood?
It comes down to a number of factors, including the pattern of movement of the rainstorm in each particular watershed, the conditions of the soil and plant matter in the watershed, and the timing of the rainstorm in one watershed versus other watersheds. For example, if the ground is already saturated before a rainstorm, much of the rain will run off into streams, but if the ground is dry, it will...
We had a "100-year flood" two years in a row. How can that be?
The term "100-year flood" is used to describe the recurrence interval of floods. The 100-year recurrence interval means that a flood of that magnitude has a one percent chance of occurring in any given year. In other words, the chances that a river will flow as high as the 100-year flood stage this year is 1 in 100. Statistically, each year begins with the same 1-percent chance that a 100-year...
What is a 1,000-year flood?
The term “1,000-year flood” means that, statistically speaking, a flood of that magnitude (or greater) has a 1 in 1,000 chance of occurring in any given year. In terms of probability, the 1,000-year flood has a 0.1% chance of happening in any given year. These statistical values are based on observed data.
Where can I find flood maps?
FEMA is the official public source for flood maps for insurance purposes: FEMA’s Flood Map Service Center FEMA’s National Flood Hazard Layer NOAA is responsible for producing flood forecast maps that combine precipitation data with USGS streamflow data: National Weather Service - Advanced Hydrologic Prediction Service River Forecasts Long-Range River Flood Risk Coastal Inundation Dashboard: Real...
Why do the values for the 100-year flood seem to change with every flood?
The amount of water corresponding to a 100-year flood, a 500-year flood, or a 1,000-year flood is known as a "flood quantile". For instance, on a given river, the flood quantile corresponding to the 50-year flood might be 10,000 cubic feet per second (cfs) and the flood quantile corresponding to the 100-year flood might be 15,000 cfs. The estimates of the flood quantiles are calculated using...

How USGS gages are used in flood forecasting
The U.S. Geological Survey (USGS) operates an extensive nationwide network of stream, rain, and groundwater gages. These instruments are used to monitor how much water there is across the Nation at any given moment. Stream data are collected at streamgages every 15 minutes, transmitted to USGS servers, and updated online in real time. To improve awareness of current water conditions and possible f
Flood-frequency estimation for very low annual exceedance probabilities using historical, paleoflood, and regional information with consideration of nonstationarity
Guidelines for determining flood flow frequency — Bulletin 17C
Field manual for identifying and preserving high-water mark data
Identifying and preserving high-water mark data
Overview of the ARkStorm scenario
The U.S. Geological Survey, Multi Hazards Demonstration Project (MHDP) uses hazards science to improve resiliency of communities to natural disasters including earthquakes, tsunamis, wildfires, landslides, floods and coastal erosion. The project engages emergency planners, businesses, universities, government agencies, and others in preparing for major natural disasters. The project also helps to
100-Year flood–it's all about chance
An evaluation of selected extraordinary floods in the United States reported by the U.S. Geological Survey and implications for future advancement of flood science
The world's largest floods, past and present: Their causes and magnitudes
Mapping a flood before it happens
Large floods in the United States: where they happen and why
Significant Floods in the United States During the 20th century - USGS Measures a Century of Floods
Related Content
- FAQ
What are the two types of floods?
There are two basic types of floods: flash floods and the more widespread river floods. Flash floods generally cause greater loss of life and river floods generally cause greater loss of property. A flash flood occurs when runoff from excessive rainfall causes a rapid rise in the water height (stage) of a stream or normally-dry channel. Flash floods are more common in areas with a dry climate and...
Does an increase in the 100-year flood estimate originate from climate or land-use change?
Climate variability (dry cycles to wet cycles) and land-use change play a significant role, but there is a large amount of uncertainty around the flood quantile estimates (the value of discharge corresponding to the 100-year flood), particularly if there isn’t a long record of observed data at a stream location. Learn more: The 100-Year Flood The 100-Year Flood--It's All About Chance
How can a 1,000-year rainfall not result in a 1,000-year flood?
It comes down to a number of factors, including the pattern of movement of the rainstorm in each particular watershed, the conditions of the soil and plant matter in the watershed, and the timing of the rainstorm in one watershed versus other watersheds. For example, if the ground is already saturated before a rainstorm, much of the rain will run off into streams, but if the ground is dry, it will...
We had a "100-year flood" two years in a row. How can that be?
The term "100-year flood" is used to describe the recurrence interval of floods. The 100-year recurrence interval means that a flood of that magnitude has a one percent chance of occurring in any given year. In other words, the chances that a river will flow as high as the 100-year flood stage this year is 1 in 100. Statistically, each year begins with the same 1-percent chance that a 100-year...
What is a 1,000-year flood?
The term “1,000-year flood” means that, statistically speaking, a flood of that magnitude (or greater) has a 1 in 1,000 chance of occurring in any given year. In terms of probability, the 1,000-year flood has a 0.1% chance of happening in any given year. These statistical values are based on observed data.
Where can I find flood maps?
FEMA is the official public source for flood maps for insurance purposes: FEMA’s Flood Map Service Center FEMA’s National Flood Hazard Layer NOAA is responsible for producing flood forecast maps that combine precipitation data with USGS streamflow data: National Weather Service - Advanced Hydrologic Prediction Service River Forecasts Long-Range River Flood Risk Coastal Inundation Dashboard: Real...
Why do the values for the 100-year flood seem to change with every flood?
The amount of water corresponding to a 100-year flood, a 500-year flood, or a 1,000-year flood is known as a "flood quantile". For instance, on a given river, the flood quantile corresponding to the 50-year flood might be 10,000 cubic feet per second (cfs) and the flood quantile corresponding to the 100-year flood might be 15,000 cfs. The estimates of the flood quantiles are calculated using...
- Multimedia
What is a "500 year flood", and how do scientists determine if a flood is considered a "500 year flood"?
- Publications
How USGS gages are used in flood forecasting
The U.S. Geological Survey (USGS) operates an extensive nationwide network of stream, rain, and groundwater gages. These instruments are used to monitor how much water there is across the Nation at any given moment. Stream data are collected at streamgages every 15 minutes, transmitted to USGS servers, and updated online in real time. To improve awareness of current water conditions and possible f
AuthorsSteven SobieszczykFlood-frequency estimation for very low annual exceedance probabilities using historical, paleoflood, and regional information with consideration of nonstationarity
Streamflow estimates for floods with an annual exceedance probability of 0.001 or lower are needed to accurately portray risks to critical infrastructure, such as nuclear powerplants and large dams. However, extrapolating flood-frequency curves developed from at-site systematic streamflow records to very low annual exceedance probabilities (less than 0.001) results in large uncertainties in the stAuthorsKaren R. Ryberg, Kelsey A. Kolars, Julie E. Kiang, Meredith L. CarrGuidelines for determining flood flow frequency — Bulletin 17C
Accurate estimates of flood frequency and magnitude are a key component of any effective nationwide flood risk management and flood damage abatement program. In addition to accuracy, methods for estimating flood risk must be uniformly and consistently applied because management of the Nation’s water and related land resources is a collaborative effort involving multiple actors including most levelAuthorsJohn F. England, Timothy A. Cohn, Beth A. Faber, Jery R. Stedinger, Wilbert O. Thomas, Andrea G. Veilleux, Julie E. Kiang, Robert R. Mason,Field manual for identifying and preserving high-water mark data
This field manual provides general guidance for identifying and collecting high-water marks and is meant to be used by field personnel as a quick reference. The field manual describes purposes for collecting and documenting high-water marks along with the most common types of high-water marks. The manual provides a list of suggested field equipment, describes rules of thumb and best practices forAuthorsToby D. Feaster, Todd A. KoenigIdentifying and preserving high-water mark data
High-water marks provide valuable data for understanding recent and historical flood events. The proper collection and recording of high-water mark data from perishable and preserved evidence informs flood assessments, research, and water resource management. Given the high cost of flooding in developed areas, experienced hydrographers, using the best available techniques, can contribute high-qualAuthorsTodd A. Koenig, Jennifer L. Bruce, Jim O'Connor, Benton D. McGee, Robert R. Holmes, Ryan Hollins, Brandon T. Forbes, Michael S. Kohn, Mathew Schellekens, Zachary W. Martin, Marie C. PepplerOverview of the ARkStorm scenario
The U.S. Geological Survey, Multi Hazards Demonstration Project (MHDP) uses hazards science to improve resiliency of communities to natural disasters including earthquakes, tsunamis, wildfires, landslides, floods and coastal erosion. The project engages emergency planners, businesses, universities, government agencies, and others in preparing for major natural disasters. The project also helps to
AuthorsKeith Porter, Anne Wein, Charles N. Alpers, Allan Baez, Patrick L. Barnard, James Carter, Alessandra Corsi, James Costner, Dale Cox, Tapash Das, Mike Dettinger, James Done, Charles Eadie, Marcia Eymann, Justin Ferris, Prasad Gunturi, Mimi Hughes, Robert Jarrett, Laurie Johnson, Hanh Dam Le-Griffin, David Mitchell, Suzette Morman, Paul Neiman, Anna Olsen, Suzanne Perry, Geoffrey Plumlee, Martin Ralph, David Reynolds, Adam Rose, Kathleen Schaefer, Julie Serakos, William Siembieda, Jonathan D. Stock, David Strong, Ian Sue Wing, Alex Tang, Pete Thomas, Ken Topping, Chris Wills, Lucile JonesByNatural Hazards Mission Area, Coastal and Marine Hazards and Resources Program, Earthquake Hazards Program, Science Application for Risk Reduction, Geologic Hazards Science Center, Pacific Coastal and Marine Science Center, Big Sur Landslides, Reducing Risk, San Francisco Bay and Sacramento-San Joaquin Delta Estuary100-Year flood–it's all about chance
In the 1960's, the United States government decided to use the 1-percent annual exceedance probability (AEP) flood as the basis for the National Flood Insurance Program. The 1-percent AEP flood was thought to be a fair balance between protecting the public and overly stringent regulation. Because the 1-percent AEP flood has a 1 in 100 chance of being equaled or exceeded in any 1 year, and it has aAuthorsRobert R. Holmes, Karen DinicolaAn evaluation of selected extraordinary floods in the United States reported by the U.S. Geological Survey and implications for future advancement of flood science
Thirty flood peak discharges determine the envelope curve of maximum floods documented in the United States by the U.S. Geological Survey. These floods occurred from 1927 to 1978 and are extraordinary not just in their magnitude, but in their hydraulic and geomorphic characteristics. The reliability of the computed discharge of these extraordinary floods was reviewed and evaluated using current (2AuthorsJohn E. Costa, Robert D. JarrettThe world's largest floods, past and present: Their causes and magnitudes
Floods are among the most powerful forces on earth. Human societies worldwide have lived and died with floods from the very beginning, spawning a prominent role for floods within legends, religions, and history. Inspired by such accounts, geologists, hydrologists, and historians have studied the role of floods on humanity and its supporting ecosystems, resulting in new appreciation for the many-faAuthorsJim E. O'Connor, John E. CostaMapping a flood before it happens
What's missing from flood forecasts? Maps—The only maps generally available today are maps used for planning. They are maps of theoretical floods, not maps of flooding forecast for an approaching storm. The U.S. Geological Survey (USGS) and the National Weather Service (NWS) have developed a way to bring flood forecasting and flood mapping together, producing flood maps for tomorrow's flood today.AuthorsJoseph L. JonesLarge floods in the United States: where they happen and why
The spatial distribution of large gaged floods throughout the United States shows that the locations of most of the largest flows are related to specific combinations of regional climatology, topography, and basin size. Key factors include the general northward trend of decreasing atmospheric moisture, proximity to oceanic moisture sources such as the Pacific Ocean and the Gulf of Mexico, and orieAuthorsJim E. O'Connor, John E. CostaSignificant Floods in the United States During the 20th century - USGS Measures a Century of Floods
No abstract available.AuthorsCharles A. Perry - News