
Data Visualization by Type
Visualizations are listed by type, along with the corresponding supporting materials for teachers.
MAP
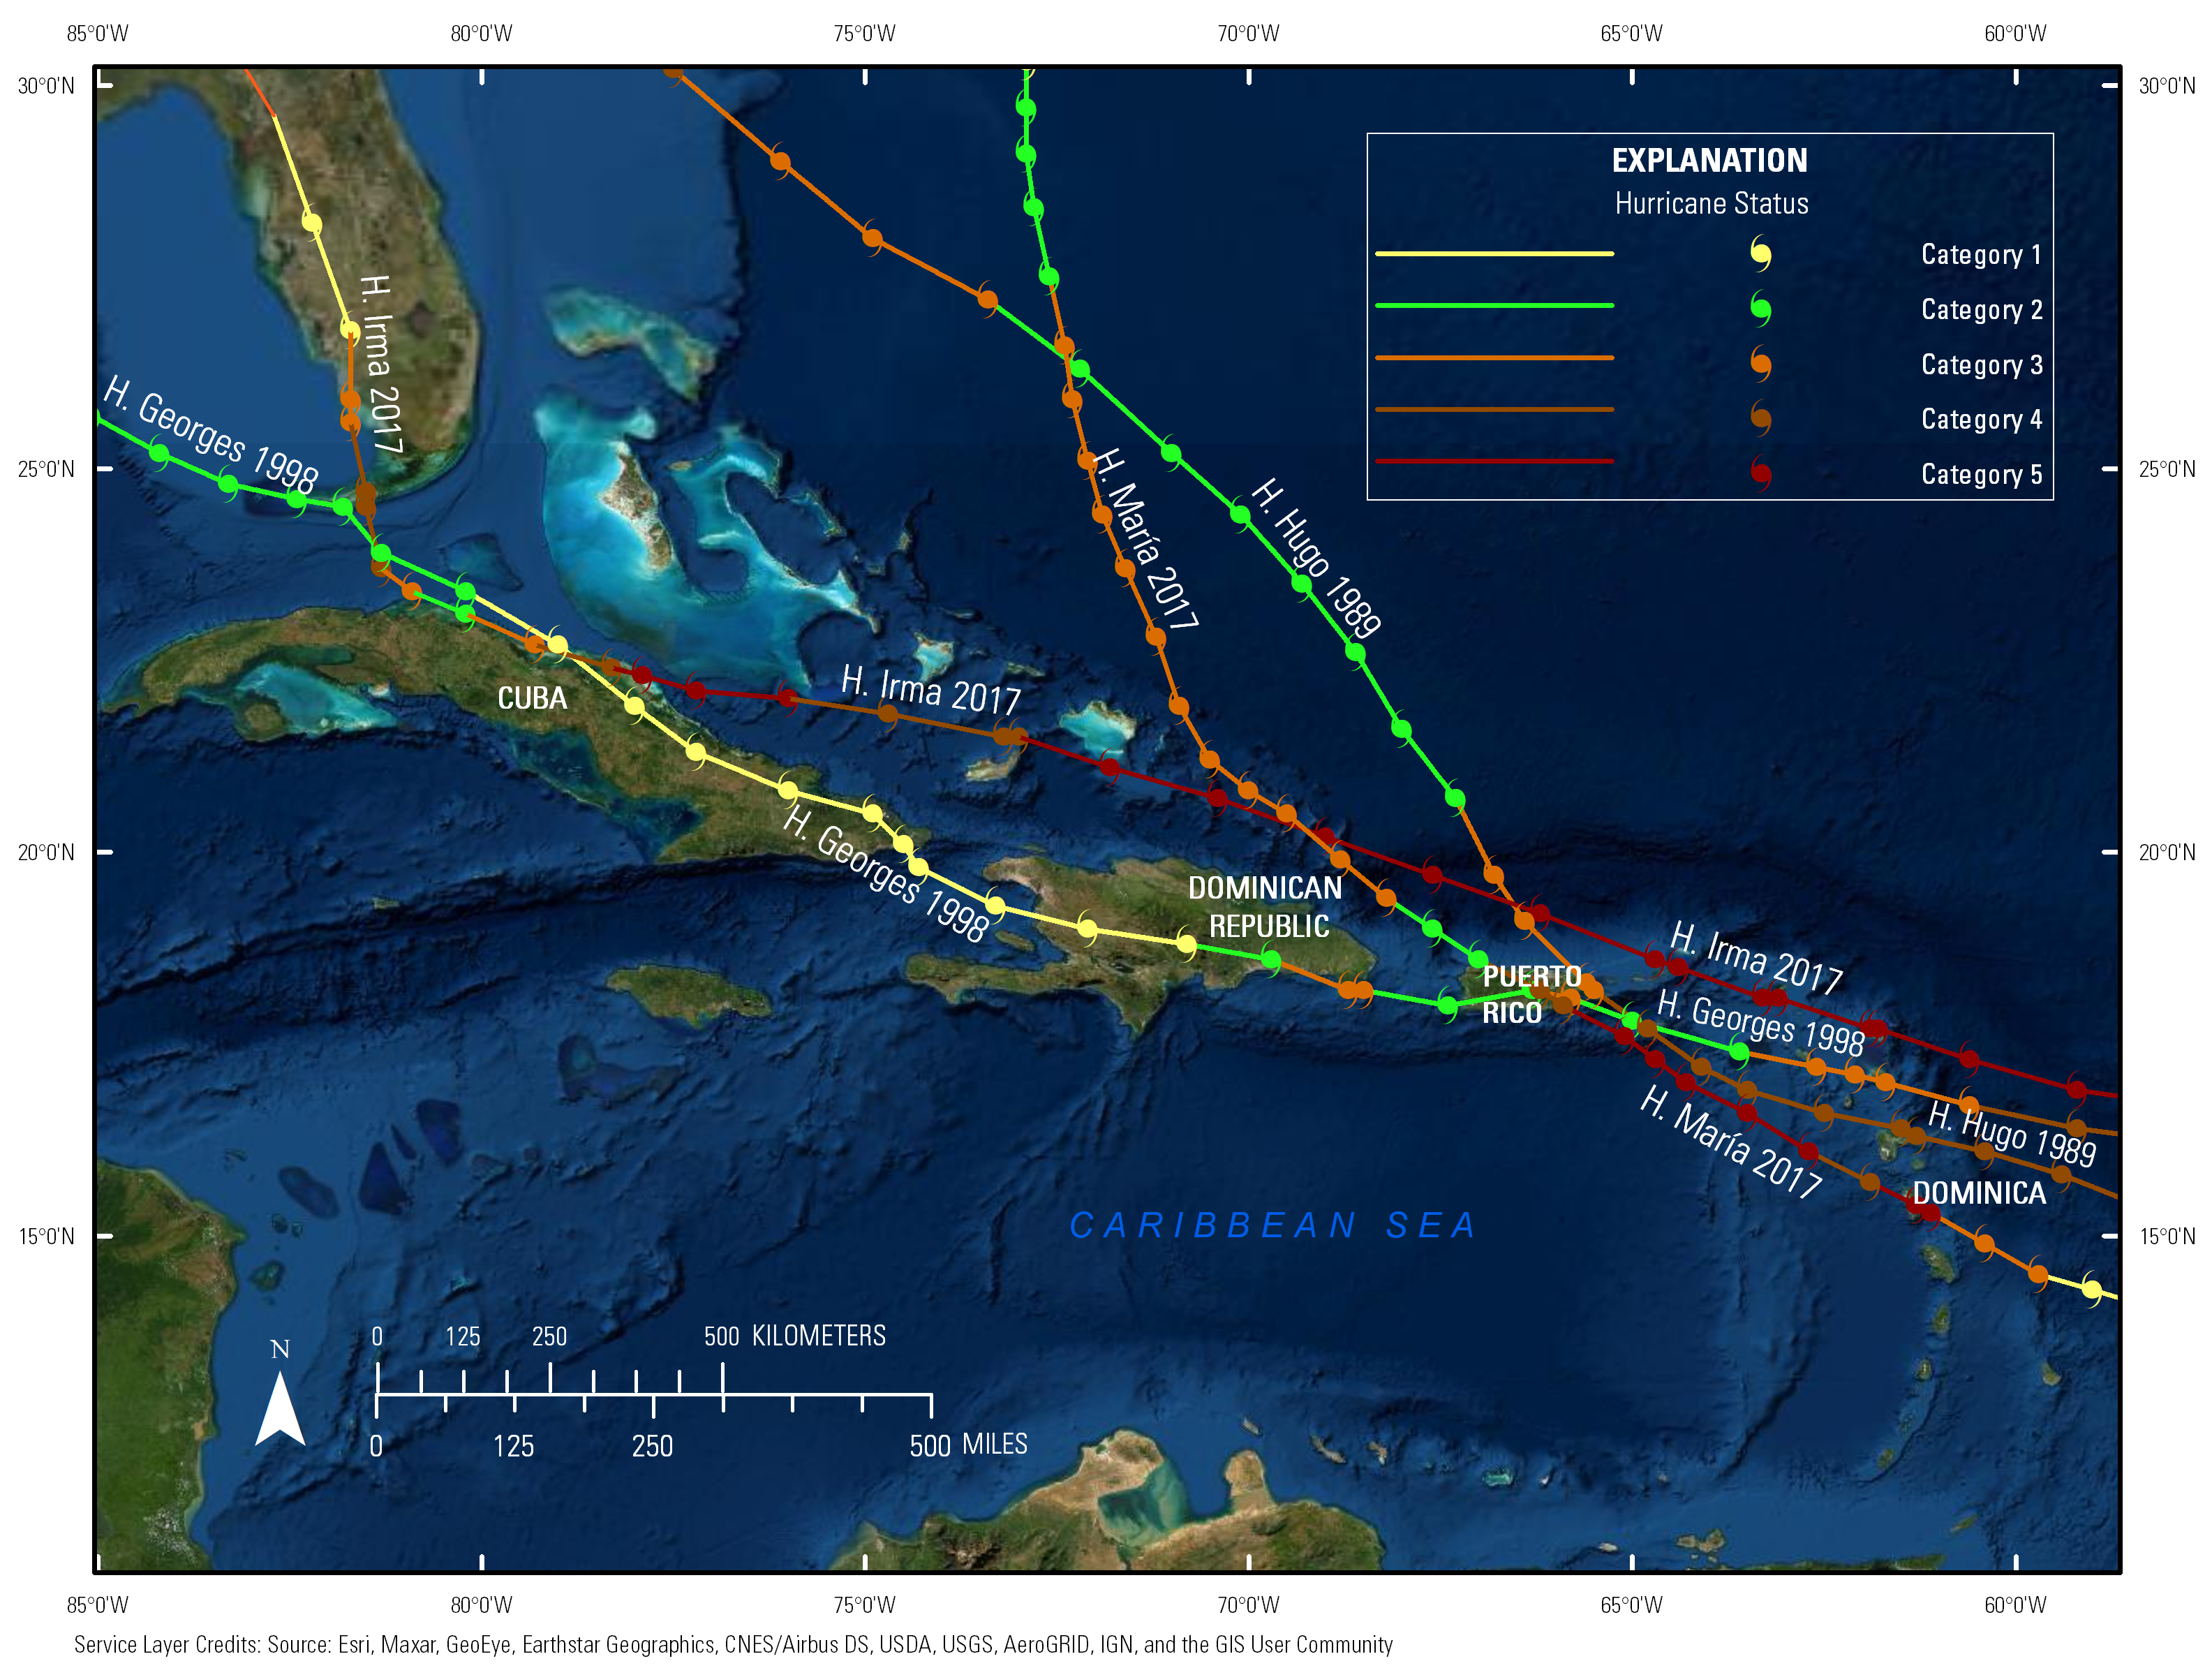
Hurricane Path Map
Hurricanes are classified into five categories based on their intensity, maximum sustained wind speeds and damaging powers. This visualization includes the classification and paths of 4 hurricanes from 1998 - 2017 in the Southeast region of the United States and the Caribbean.
Teacher Document for Hurricane Path Map
Value of Nonfuel Minerals
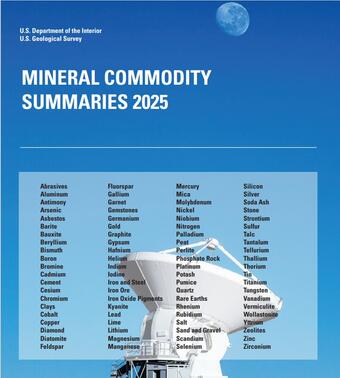
The US Geological Survey collects nonfuel mineral data about the location and availability of nonfuel mineral resources found in the United States and throughout the world. Nonfuel minerals are extracted and used for purposes other than energy production. These minerals are typically industrial minerals or metals of economic importance. The visualization found on page 12 (Figure 4) is a map and bar graph of the distribution of nonfuel minerals in the United States.
BAR
Microplastics in the Great Lakes
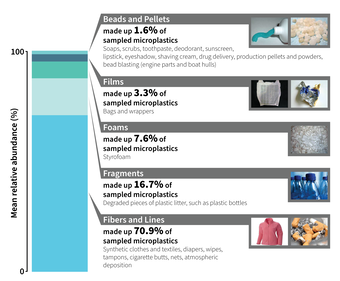
Microplastics are small plastics that can be found everywhere. USGS tracks their locations. This visualization explores microplastics found in the Great Lakes in a stacked bar graph format.
Teacher Document for Microplastics in the Great Lakes
LINE GRAPH
Electricity Generated by Renewables
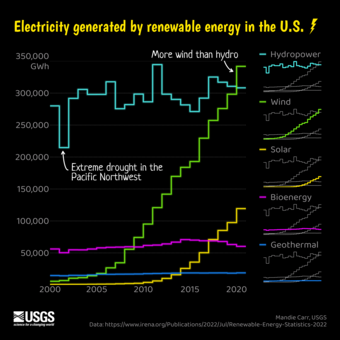
Renewable energy is energy that comes from sources that can be replenished on a human time scale. The step chart illustrates the U.S. electricity generation in gigawatt hours (GWh) across five classes of renewable energy, from 2000 to 2020.
Teacher Document for Electricity Generation
State of Amphibians
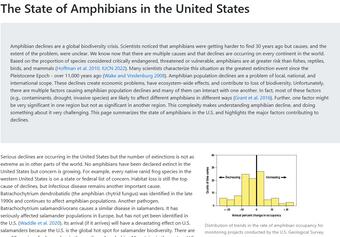
Amphibian declines represent a major environmental concern with global implications. Scientists at USGS monitor amphibian populations and estimate changes over time. This visualization is an interactive line graph that depicts anticipated changes in amphibian populations from 2024 - 2044.
Teacher Document for State of Amphibians