
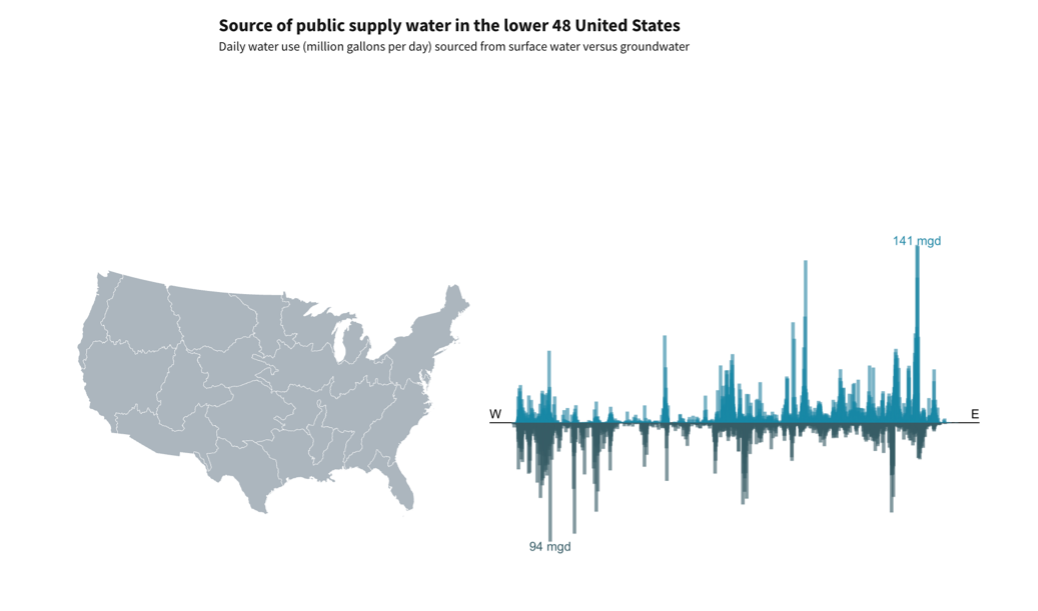
Source of public supply water in the lower 48 United States
By Water Science School
June 2025 (approx.)

Detailed Description
Daily water use (million gallons per day) sourced from surface water versus groundwater. Bar charts showing the relative amount of modeled water withdrawn for public supply that comes from surface water (bars that go up) or from groundwater (bars that go down) for the lower 48 United States. The bars are placed from west to east based on the longitude (easting) of the center of each watershed. The watershed with the largest daily water use in that region are labeled for each source.
Image from: https://water.usgs.gov/vizlab/water-availability/
Sources/Usage
Public Domain.