
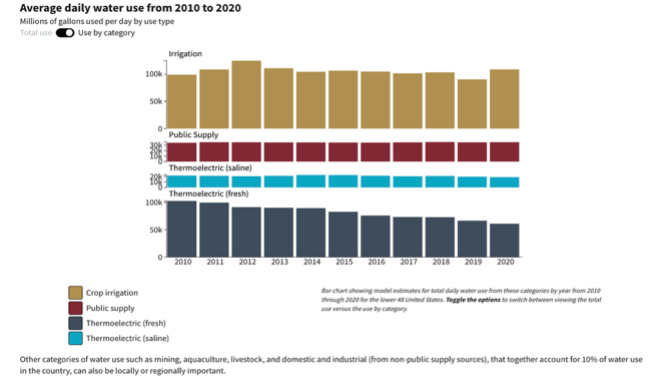
Average daily water use from 2010 to 2020 - by category
By Water Science School
June 2025 (approx.)

Detailed Description
Bar chart showing model estimates for average daily water use by category by year from 2010 through 2020 for the lower 48 United States.
Image from: https://water.usgs.gov/vizlab/water-availability/
Sources/Usage
Public Domain.