



December 2024 Streamflow


Detailed Description
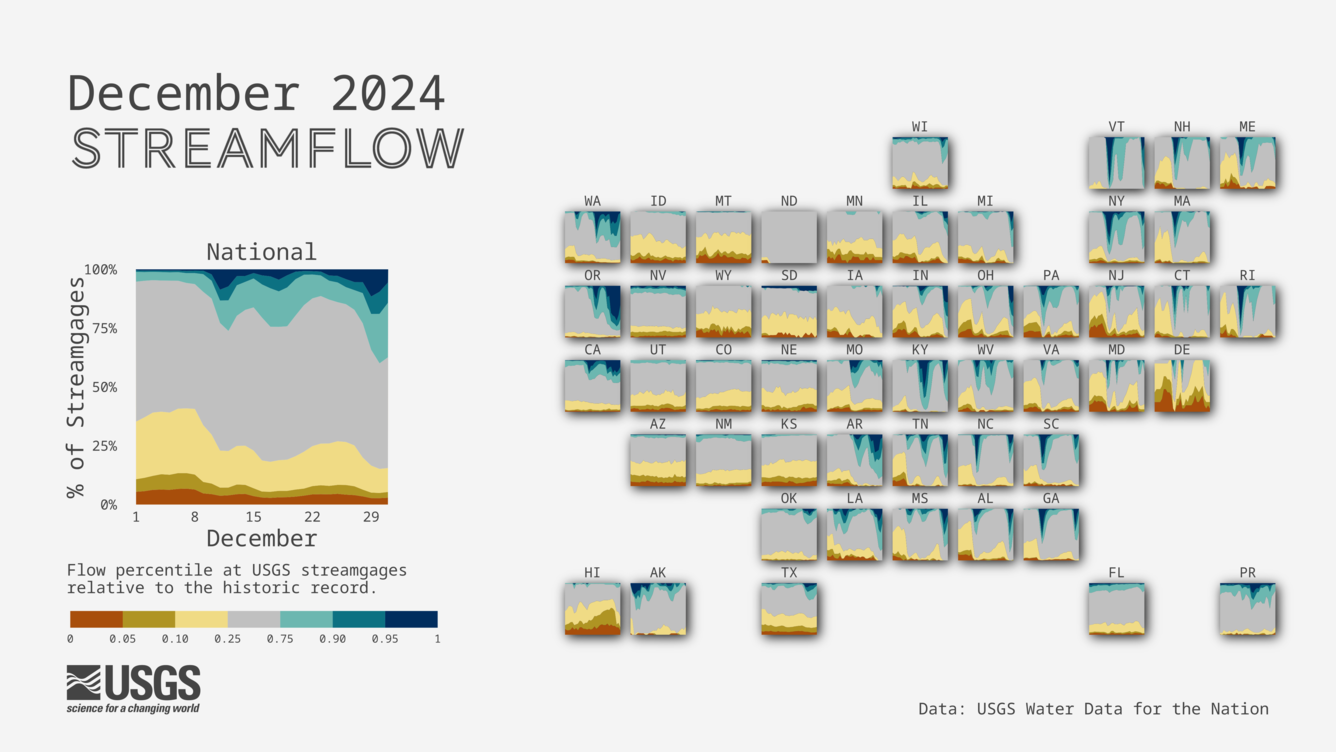
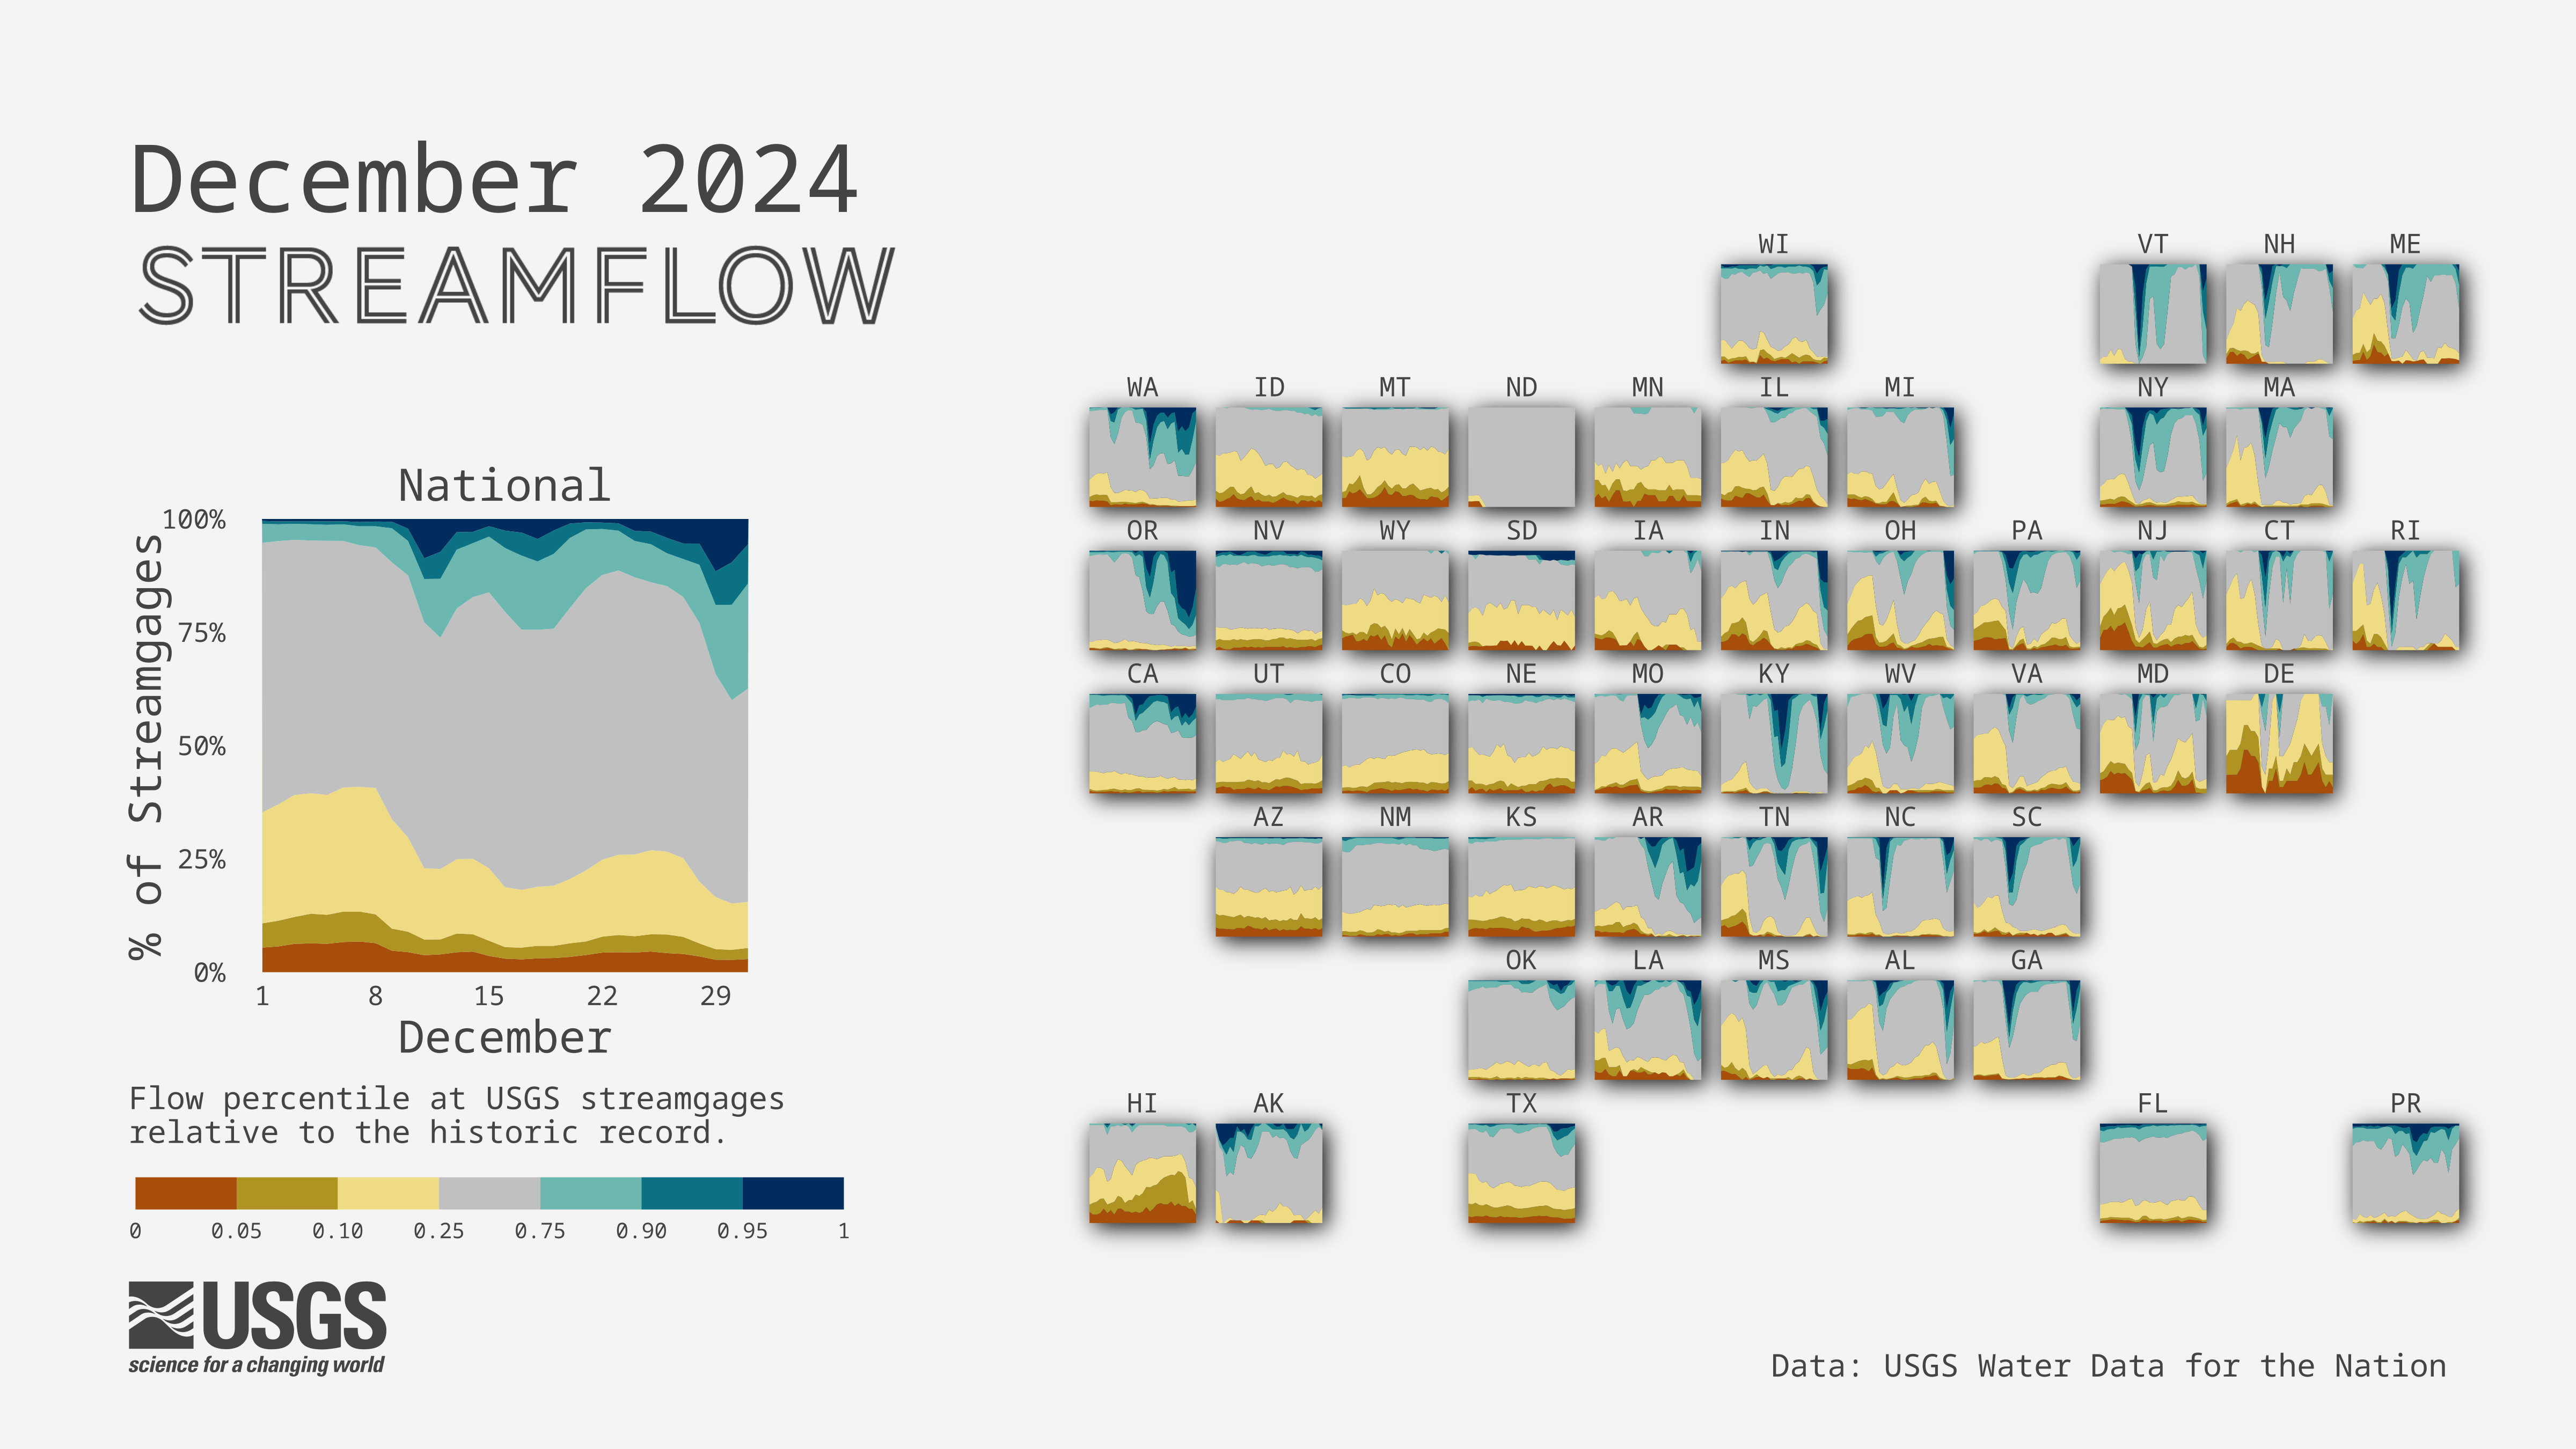
Streamflow tiles show flow levels through the month of December 2024. Dry conditions persisted for much of the Southwestern U.S. while cyclones brought wet conditions to the Pacific Coast. For each state, an area chart shows the proportion of streamgages in wet, normal, or dry conditions. Streamflow conditions are quantified using percentiles comparing the past month’s flow levels to the historic record for each streamgage.
Sources/Usage
Public Domain.