
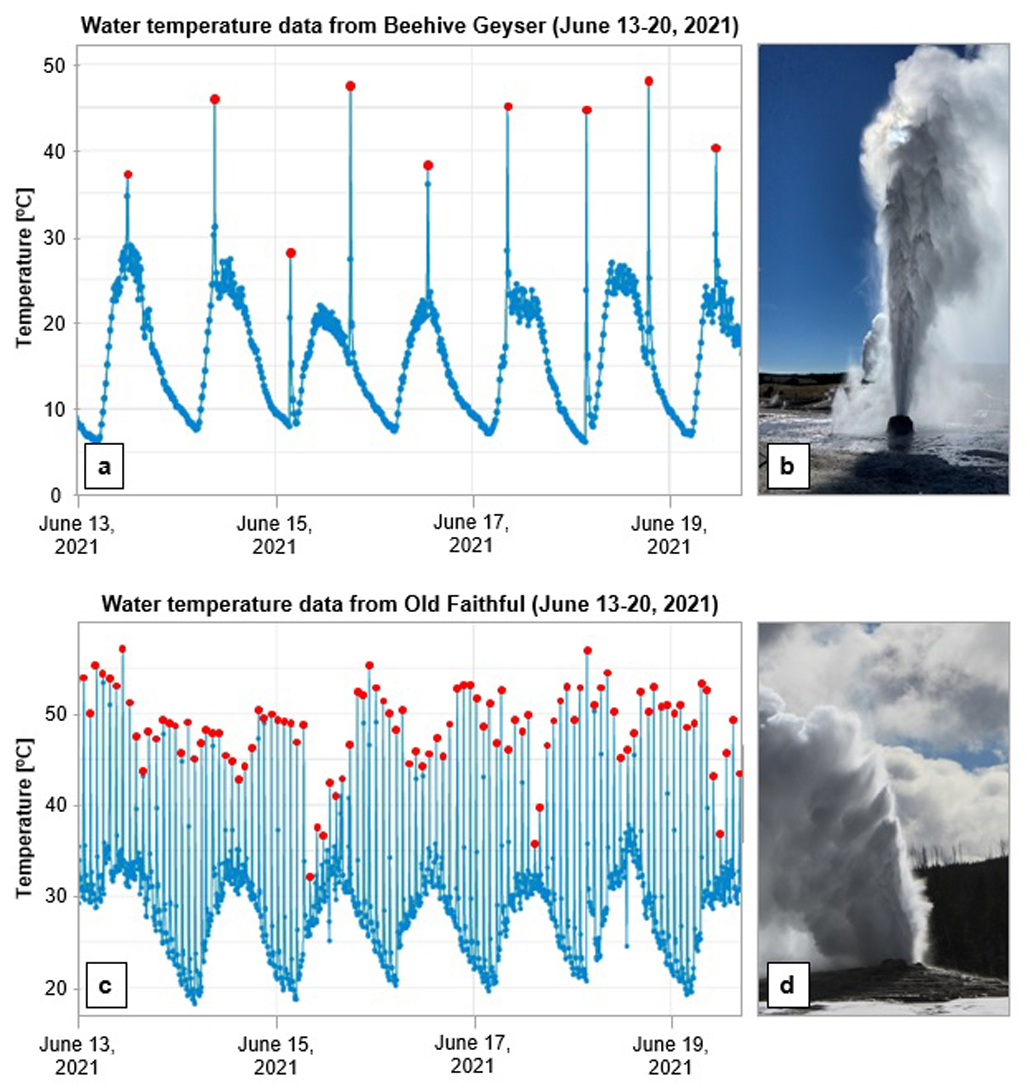
Different views of an eruption from two predictable geysers
By Yellowstone Volcano Observatory
2021 (approx.)

Detailed Description
Different views of an eruption from two predictable geysers. (a, c) Graphs showing water temperatures recorded by data loggers stationed near Beehive and Old Faithful Geysers, respectively. These data loggers were deployed by the Yellowstone Geology Program, configured to capture temperatures at one-minute intervals (indicated by blue dots). Significant upticks in temperature signify eruptions (indicated by red dots). The sawtooth pattern at the base is caused by daily average temperature variations. (b, d) Photos show Beehive and Old Faithful Geysers at the peak of their eruptions.
Sources/Usage
Public Domain.