
Earthquake activity and ground uplift at Yellowstone caldera 2003-2011
By Volcano Hazards Program
2010 (approx.)
Detailed Description
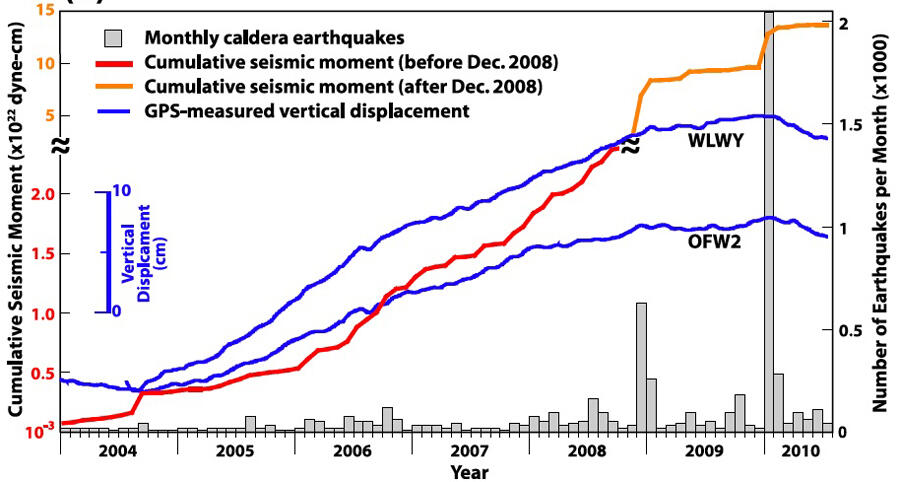
Uplift of GPS stations WLWY and OFW2 are shown as blue lines (compare with blue scale bar). The histogram (gray bars) shows the number of Yellowstone earthquakes per month (right Y axis), with most activity occurring during the period when the uplift began to slow.
Sources/Usage
Public Domain.
Chang et al, 2010