



Figure 1 - 3DEP Investments


Detailed Description
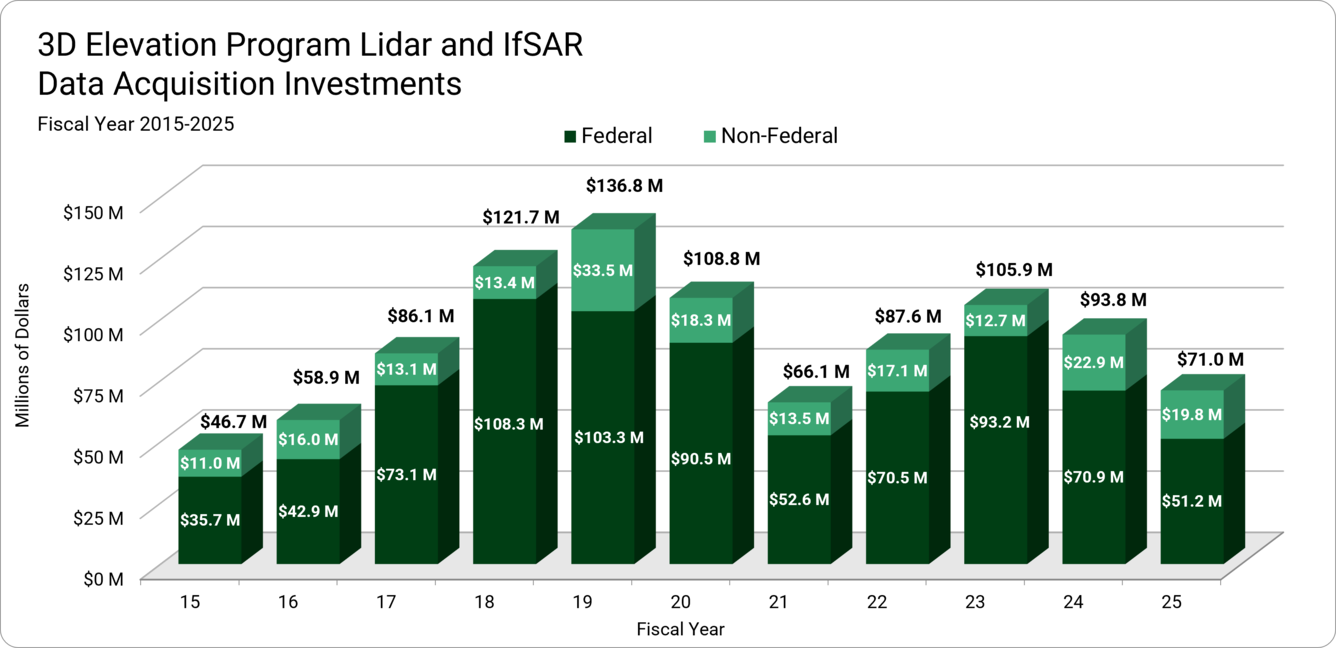
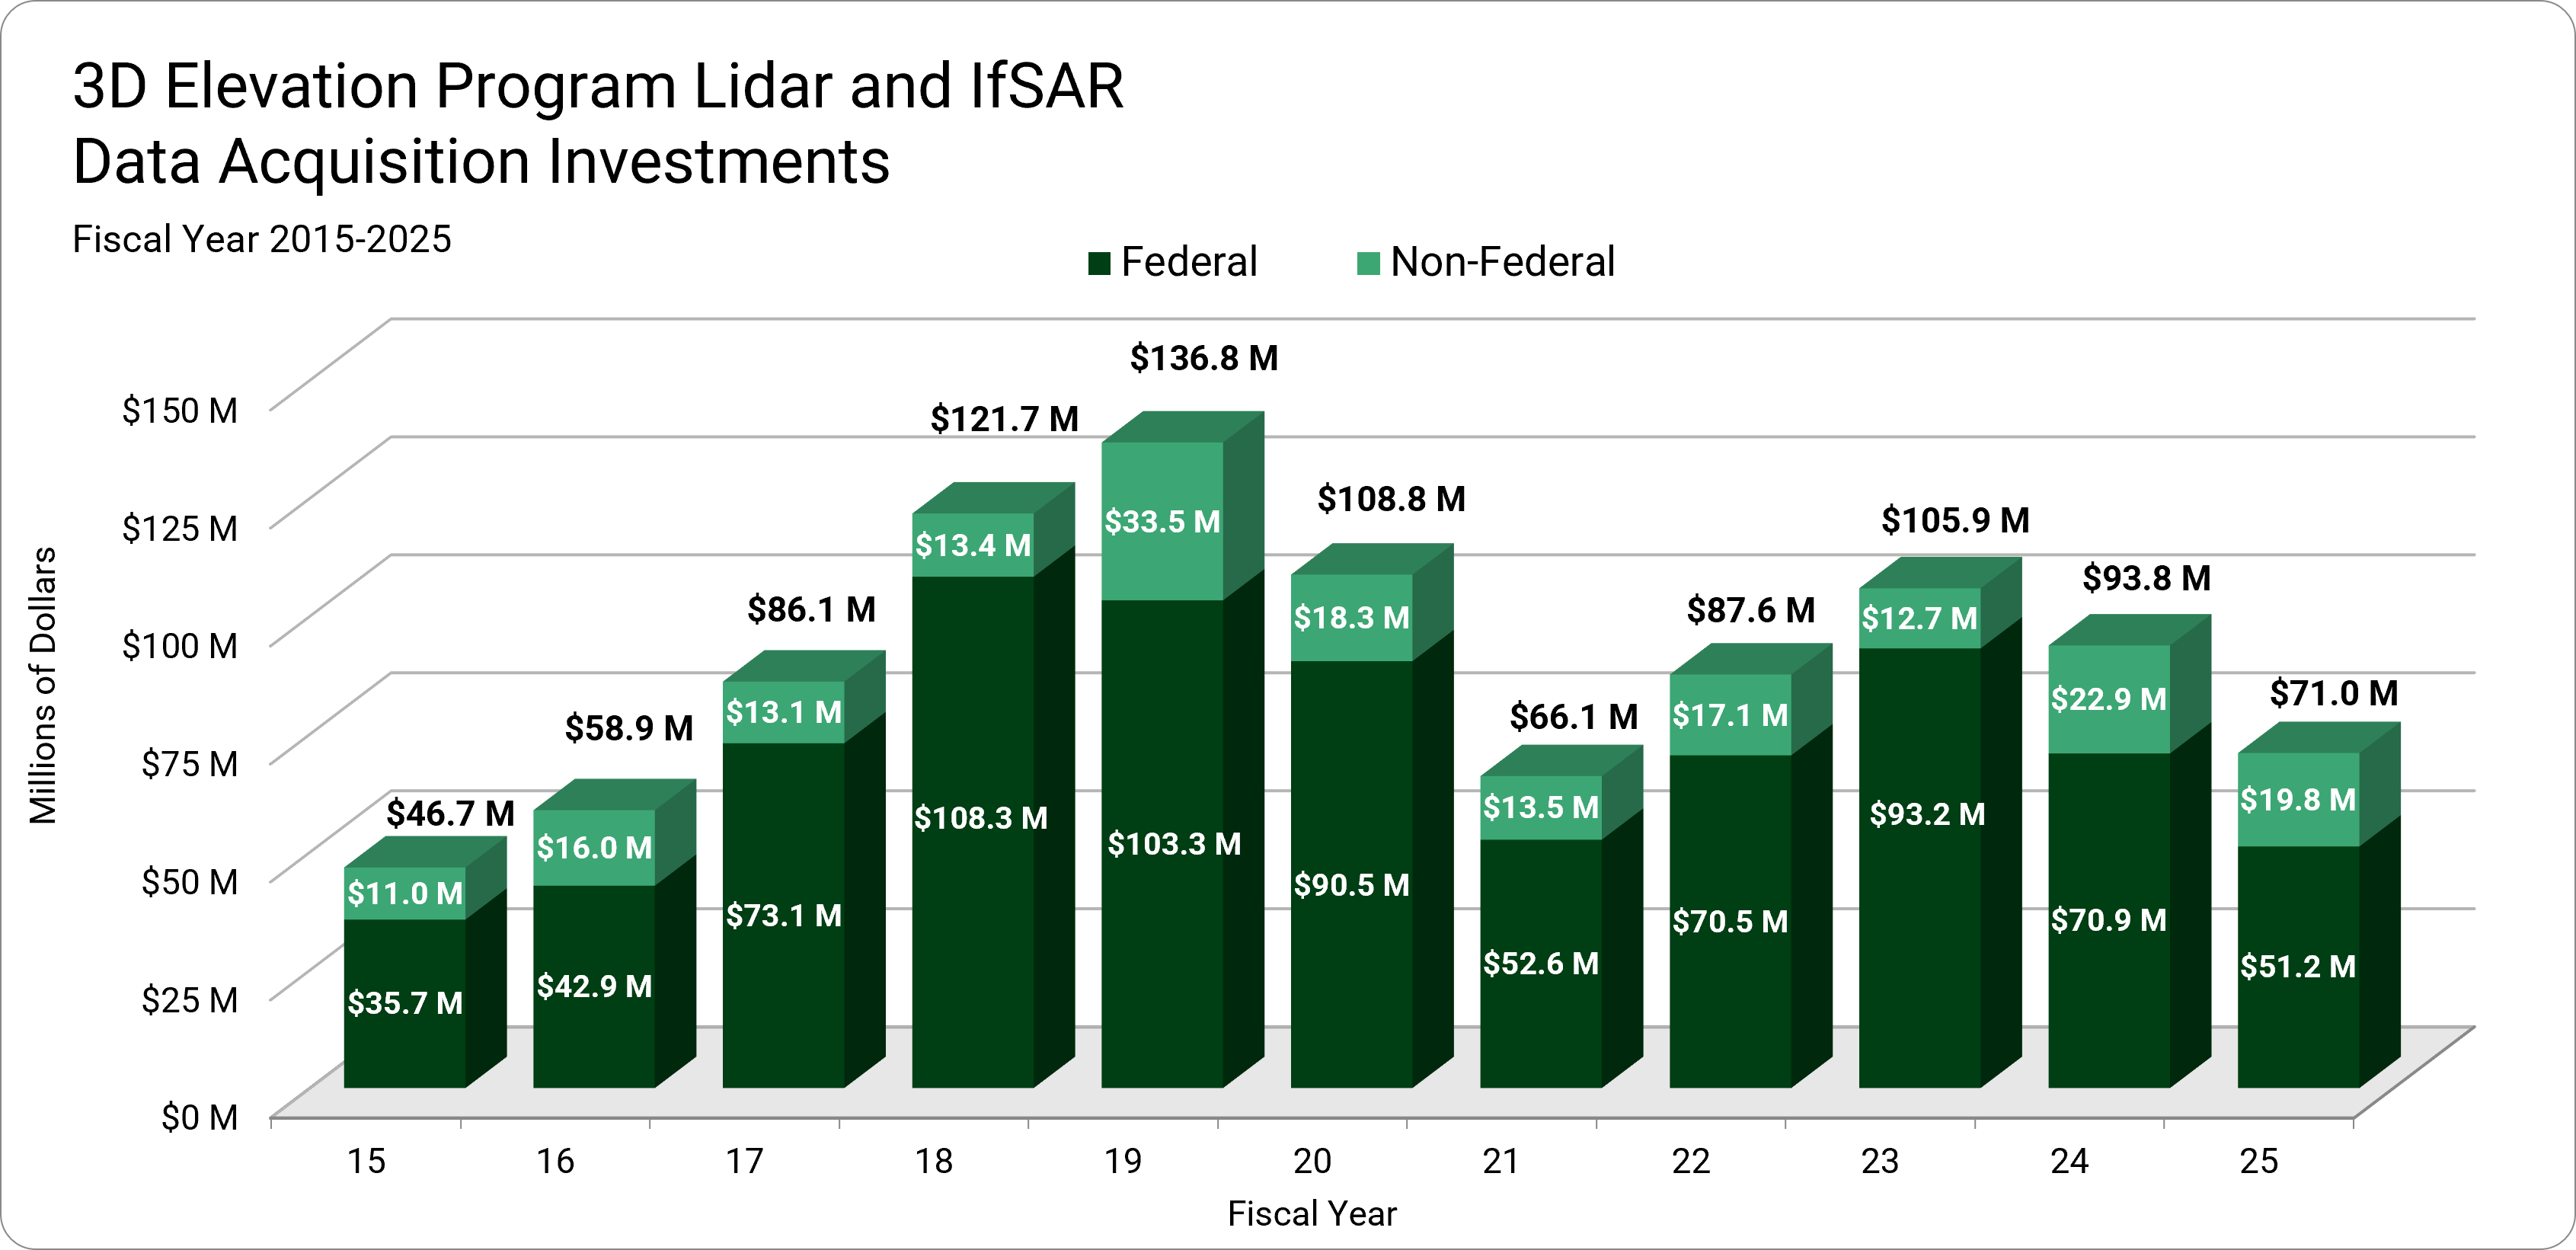
Figure 1: Bar graph showing 3D Elevation Program data acquisition from Federal and non-Federal investments for fiscal years 2015 - 2025.
This includes total 3DEP investments in data acquisition by FY, from FY 2015 to FY 2025 in the United States and U.S. territories. Funding sources include Federal, state, and local agencies, Tribes, and other partner organizations.
- FY15: \$35.7 million in Federal funds, \$11 million in non-Federal funds
- FY16: \$42.9 million in Federal funds, \$16 million in non-Federal funds
- FY17: \$73.1 million in Federal funds, \$13.1 million in non-Federal funds
- FY18: \$108.3 million in Federal funds, \$13.4 million in non-Federal funds
- FY19: \$103.3 million in Federal funds, \$33.5 million in non-Federal funds
- FY20: \$90.5 million in Federal funds, \$18.3 million in non-Federal funds
- FY21: \$52.6 million in Federal funds, \$13.5 million in non-Federal funds
- FY22: \$70.5 million in Federal funds, \$17.1 million in non-Federal funds
- FY23: \$93.2 million in Federal funds, \$12.7 million in non-Federal funds
- FY24: \$70.9 million in Federal funds, \$22.9 million in non-Federal funds
- FY25: \$51.2 million in Federal funds, \$19.8 million in non-Federal funds
Sources/Usage
Public Domain.