
Image of area around flow front
Detailed Description
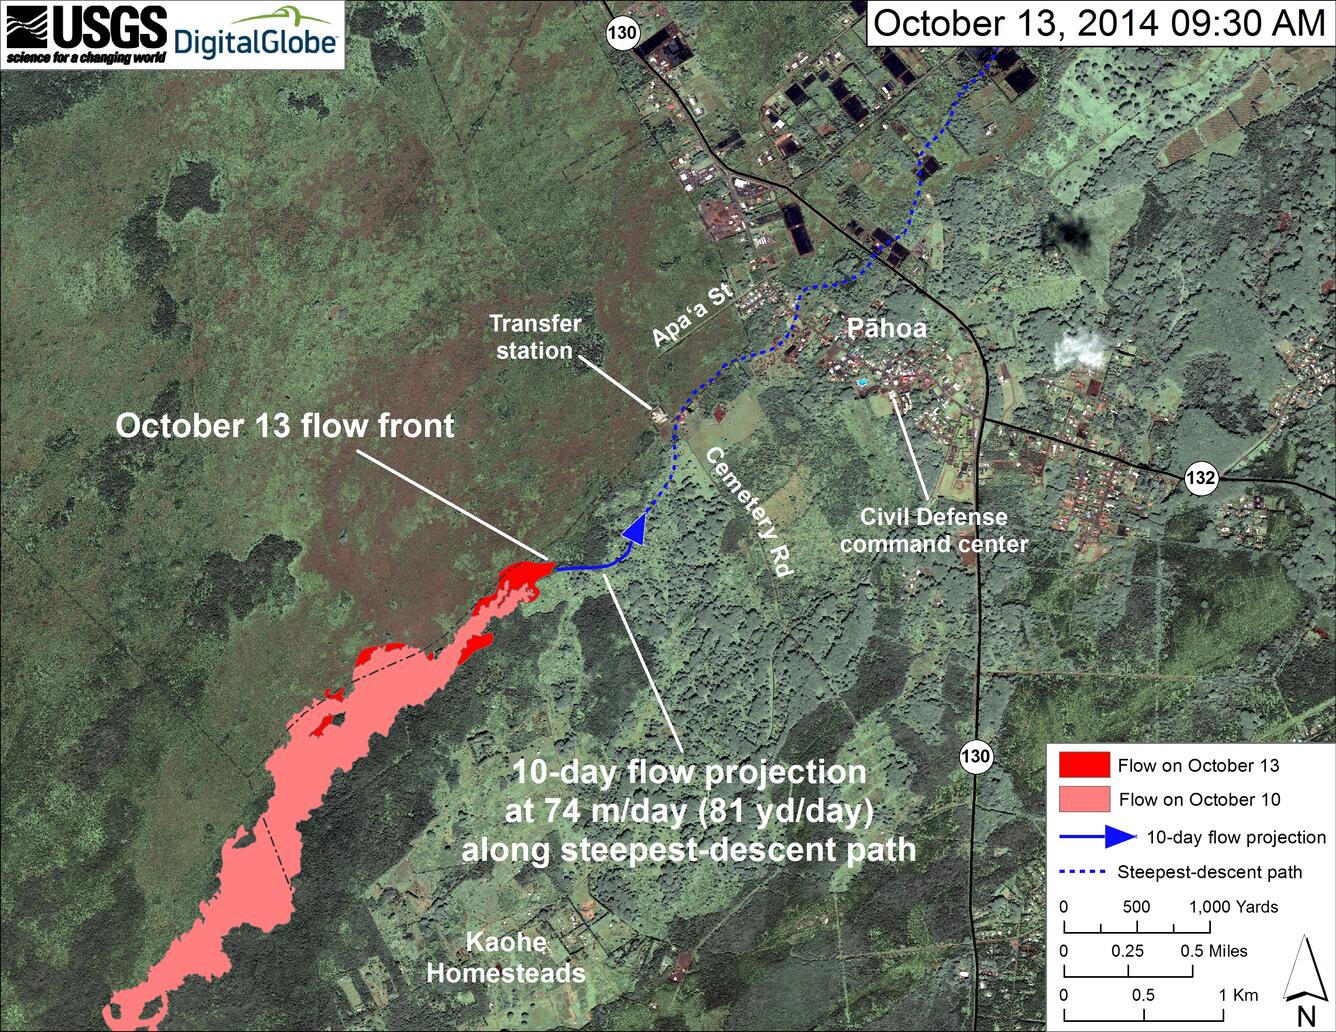
This map uses a satellite image acquired in March 2014 (provided by Digital Globe) as a base to show the area around the front of the June 27th lava flow. The area of the flow on October 10, 2014, at 10:30 AM is shown in pink, while widening and advancement of the flow as mapped on October 13 at 9:30 AM is shown in red. The flow front advanced about 220 m (240 yd) since our October 10, 2014, overflight. This puts the flow front about 1.1 km (0.7 mi) upslope from the closest point along AP‘A‘ā Street (Cemetery Road), as measured in a straight line, or about 1.4 km (0.9 mi) measured along the path of steepest-descent that the flow is currently following.
The solid blue line with the arrowhead shows the projected path of the flow over the next 10 days (to October 23), based on the steepest-descent path and the average advance rate of 74 m/day (81 yd/day) calculated for the period since October 6. The amount of lava erupted from the June 27th vent, and the advance rate of the resulting lava flow, have been variable. The flow could speed up or slow down; the flow front could stall again, and a new active flow front could start again farther upslope; or the flow could stop altogether. Thus, this projection is subject to change.
The dotted blue line shows the steepest-descent path, calculated from a 1983 digital elevation model (DEM; for calculation details, see http://pubs.usgs.gov/of/2007/1264/), that the flow is projected to follow. Steepest-descent path analysis is based on the assumption that the DEM perfectly represents the earth's surface. DEMs, however, are not perfect, so the dotted blue line can be used to infer only an approximate flow path.