
Kīlauea Volcano summit eruption — thermal map GIF
By Kīlauea
Detailed Description
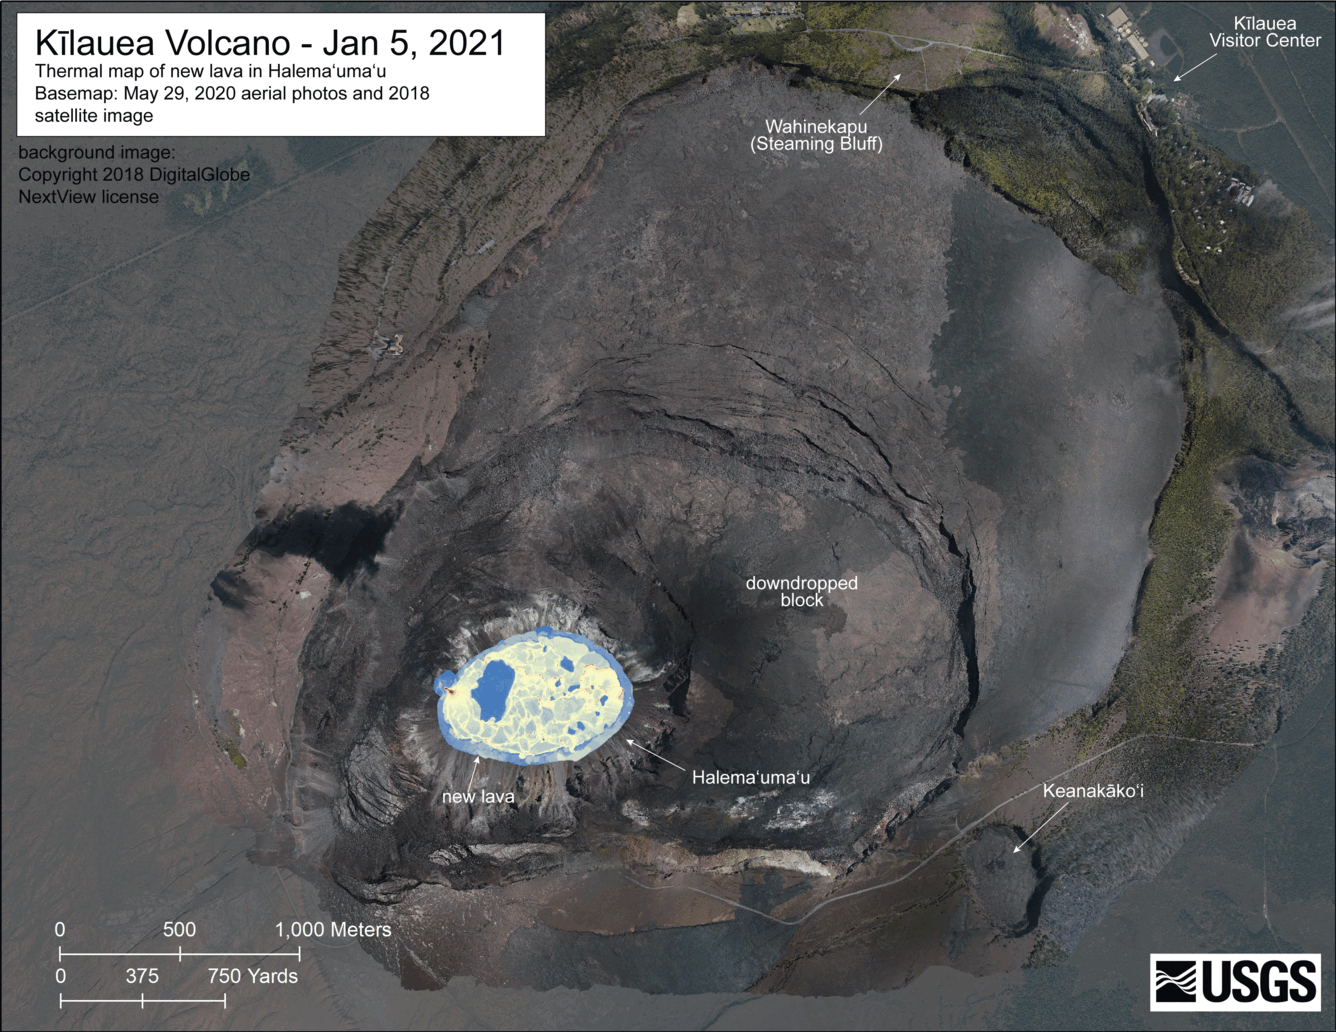
ANIMATED GIF: This animated image file (GIF) includes a series of thermal maps—ranging from daily to several weeks apart—made from helicopter overflight thermal imagery of Halema‘uma‘u crater, Kīlauea summit. The set of thermal maps are in a continuous loop showing the lava lake changes throughout the eruption. The first map was made on December 22, 2020, and the final map was made on March 4, 2021. The date of each map in the sequence is located in the upper-left corner. The scale of the thermal map ranges from blue to red, with blue colors indicative of cooler temperatures and red colors indicative of warmer temperatures. USGS thermal map GIF.
Sources/Usage
Public Domain.