
Map of difference between well withdrawals in 1999 and 2017
Detailed Description
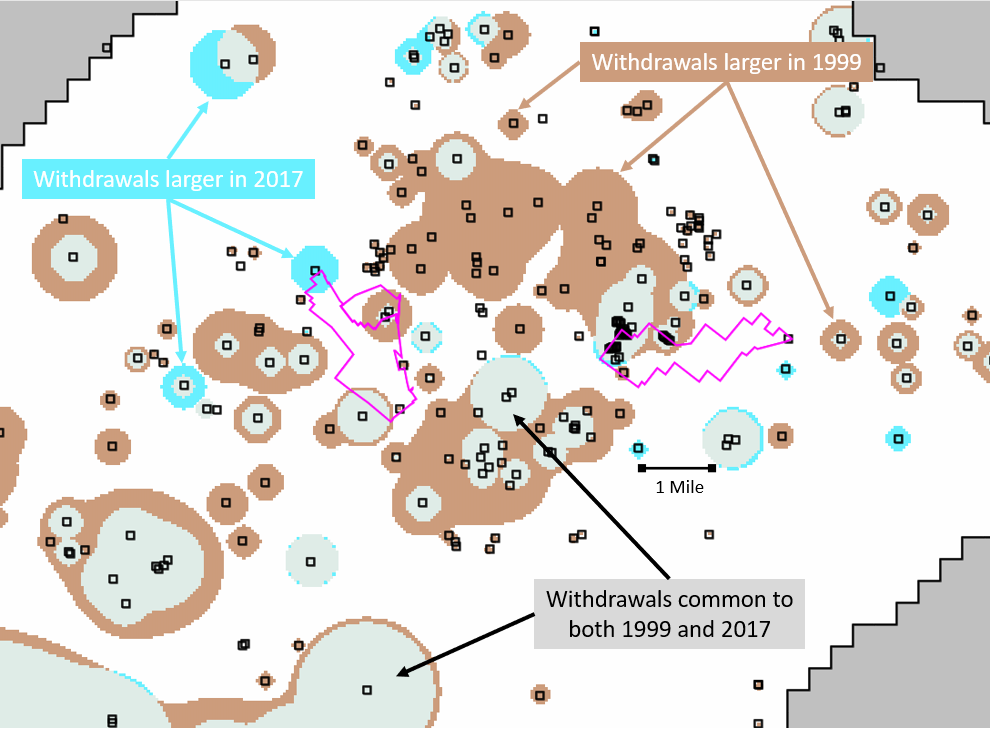
Map of difference between well withdrawals in 1999 and 2017
ModelMuse screenshot of changes in groundwater withdrawal rates in the Willow Grove and Warminster area visualized by the difference between well-withdrawal footprints for 1999 and 2017. Light gray area shows volumetric rate of withdrawals common to both years. Brown area shows decrease in volumetric rate from 1999 to 2017. Blue area shows increase in volumetric rate from 1999 to 2017. The footprint depth-rate-index (scale) is 10 inches per year. Bases shown in magenta outline, and wells as black squares.
This is Figure 18 in
Goode, D.J., and Senior, L.A., 2020, Groundwater withdrawals and regional flow paths at and near Willow Grove and Warminster, Pennsylvania—Data compilation and preliminary simulations for conditions in 1999, 2010, 2013, 2016, and 2017: U.S. Geological Survey Open-File Report 2019–1137, 127 p., https://doi.org/10.3133/ofr20191137.
Sources/Usage
Public Domain.
Groundwater withdrawals and regional flow paths at and near Willow Grove and Warminster, Pennsylvania . . .
Goode, D.J., and Senior, L.A., 2020, Groundwater withdrawals and regional flow paths at and near Willow Grove and Warminster, Pennsylvania—Data compilation and preliminary simulations for conditions in 1999, 2010, 2013, 2016, and 2017: U.S. Geological Survey Open-File Report 2019–1137, 127 p., https://doi.org/10.3133/ofr20191137.