
Map of flow field
Detailed Description
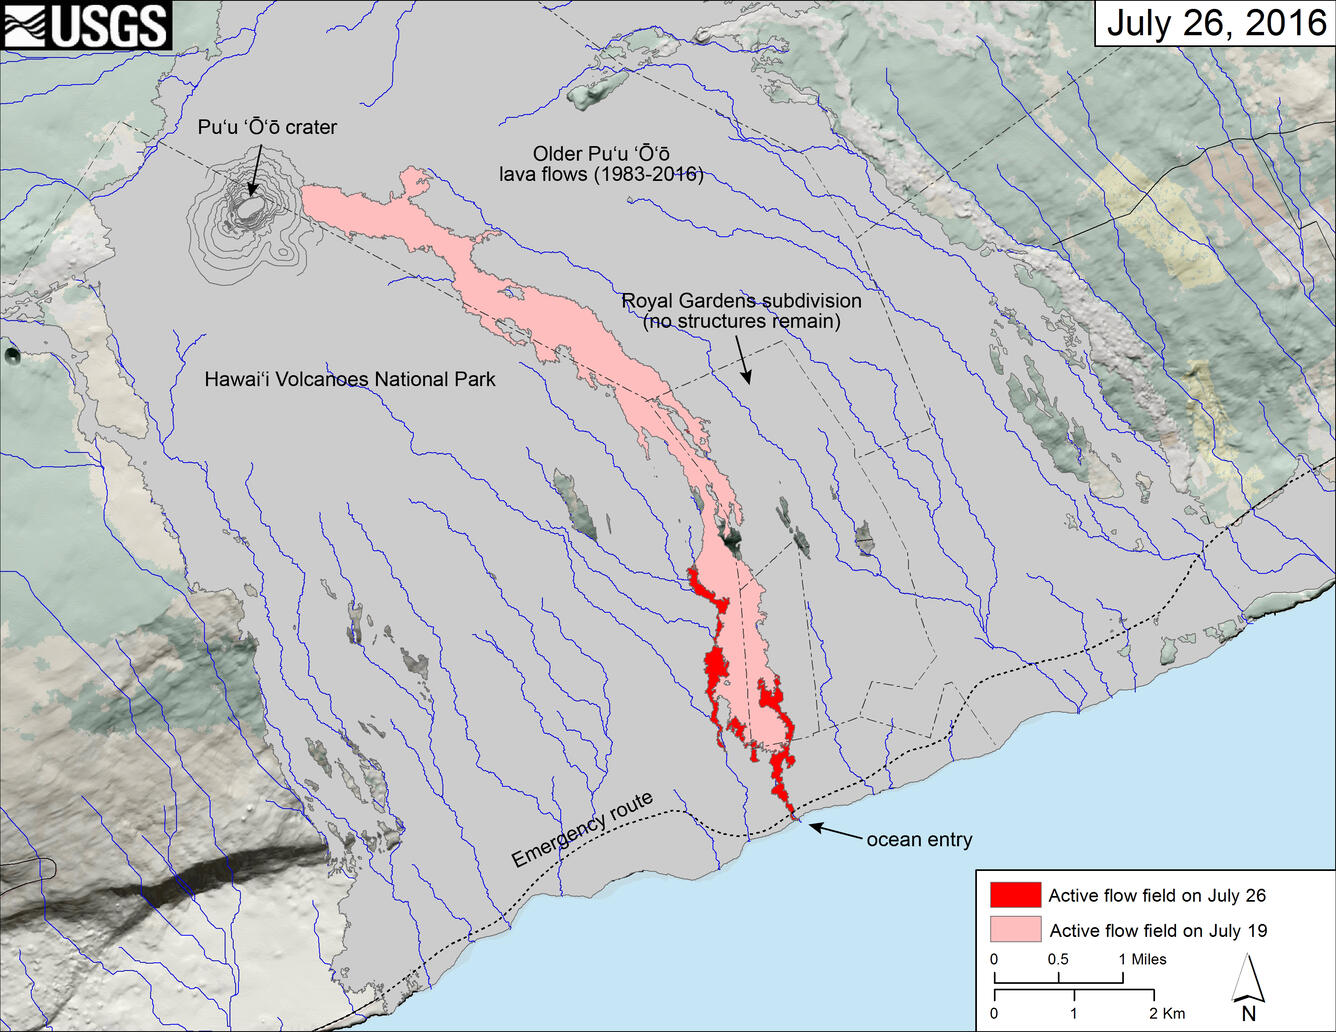
This map shows recent changes to Kīlauea's East Rift Zone lava flow field. The area of the active flow field as of July 19 is shown in pink, while widening and advancement of the active flow as mapped on July 26 is shown in red. Lava reached the ocean on the morning of July 26. Older Pu‘u ‘Ō‘ō lava flows (1983-2016) are shown in gray.
The blue lines over the Pu‘u ‘Ō‘ō flow field are steepest-descent paths calculated from a 2013 digital elevation model (DEM), while the blue lines on the rest of the map are steepest-descent paths calculated from a 1983 DEM (for calculation details, see http://pubs.usgs.gov/of/2007/1264/). Steepest-descent path analysis is based on the assumption that the DEM perfectly represents the earth's surface. DEMs, however, are not perfect, so the blue lines on this map can be used to infer only approximate flow paths. The base map is a partly transparent 1:24,000-scale USGS digital topographic map draped over the 1983 10-m digital elevation model (DEM).