
Map of the Oroville Dam showing location Feb 14, 2017 earthquake
Detailed Description
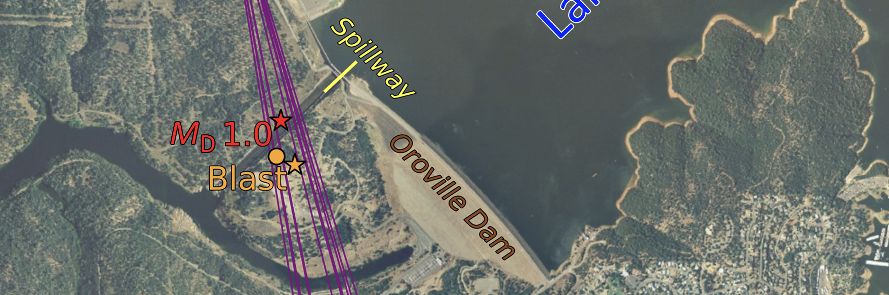
Map of the Oroville Dam showing maximum‐likelihood location of the 14 February 2017 MD 1.0 event (confidence ellipsoid east–west: 2.6 km; north–south: 0.8 km; vertical: 1.6 km). Lines represent the particle‐motion backazimuths for the 10 largest magnitude events in February 2017. The maximum‐likelihood location of the 25 April 2017 controlled blast (star) (confidence ellipsoid east–west: 3.7 km; north–south: 1.8 km; vertical: 2.2 km) and the true blast location (circle) are also shown.
Sources/Usage
Public Domain.
Microseismic Events Associated with the Oroville Dam Spillway
Robert J. Skoumal, Phillip B. Dawson, Stephen H. Hickman, J. Ole Kaven; Microseismic Events Associated with the Oroville Dam Spillway. Bulletin of the Seismological Society of America doi: https://doi.org/10.1785/0120180255