
Map with thermal mosaic overlay
Detailed Description
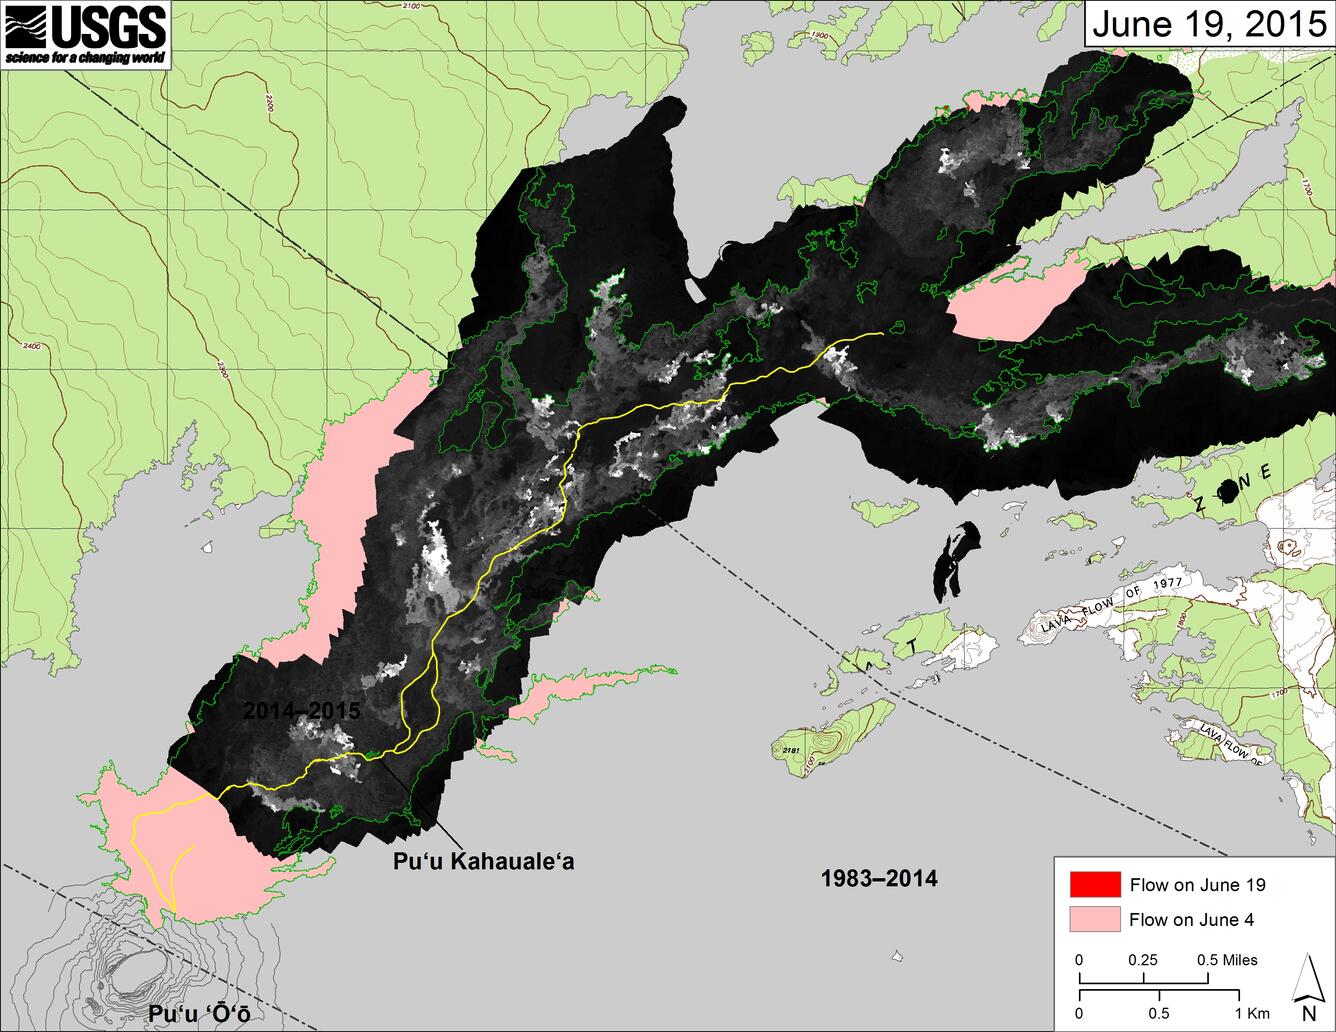
This map overlays a georeferenced thermal image mosaic onto the flow field change map above and shows the distribution of active and recently active breakouts. The thermal images were collected during a helicopter overflight of the flow field today (June 19). The June 27th flow is outlined in green to highlight the flow margin. The yellow line is the active lava tube.