
Spring 2019 Midwest flooding data visualization

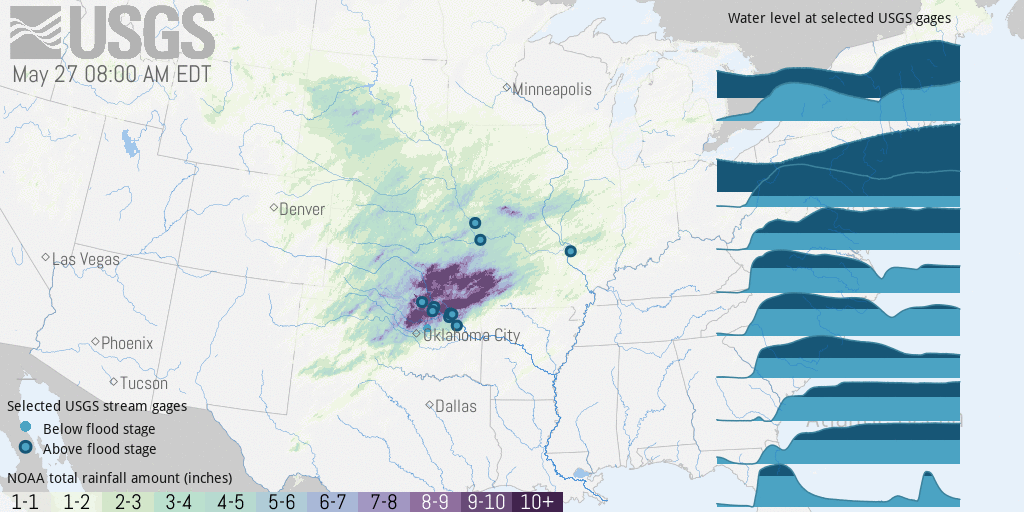
Detailed Description
This DataVisualization shows the severity of flooding in the Midwest . As of June 1, 2019, 17 USGS streamgage sites in red had the highest streamflow for the entire period of record available. Both the Mississippi and the Arkansas rivers are seeing record breaking flows. USGS employees continue to work extensively deploying equipment and making measurements of streamflow in Minnesota, the Dakotas, Oklahoma, Arkansas, Missouri, Iowa, Illinois, Kansas and Nebraska.
Since the Spring flooding began in March, USGS employees have made nearly 7,300 streamflow measurements despite snow and ice, washed out bridges and roads, and overland flooding challenges. Of these measurements, approximately 930 were made at flows above flood stage at USGS streamgages used by the NationalWeatherService in its flood-forecasting program.
This work is essential to both forecasting near-term river flows and deciding whether and when to hold back or release flood waters from the scores of major flood-control reservoirs in these states. The USGS is also documenting the maximum extent of flooding by finding and mapping highwater marks which, when joined with computer models and geospatial information systems, provide information needed to managers and emergency responders to target aid and relief activities in the affected states.
The USGS is coordinating efforts daily with the National Weather Service, US Army Corps of Engineers, Federal Emergency Management Agency, Bureau of Reclamation, and many local and state partners.
Sources/Usage
Public Domain.