



staticReveal_timelineWD_drupal.png


Detailed Description
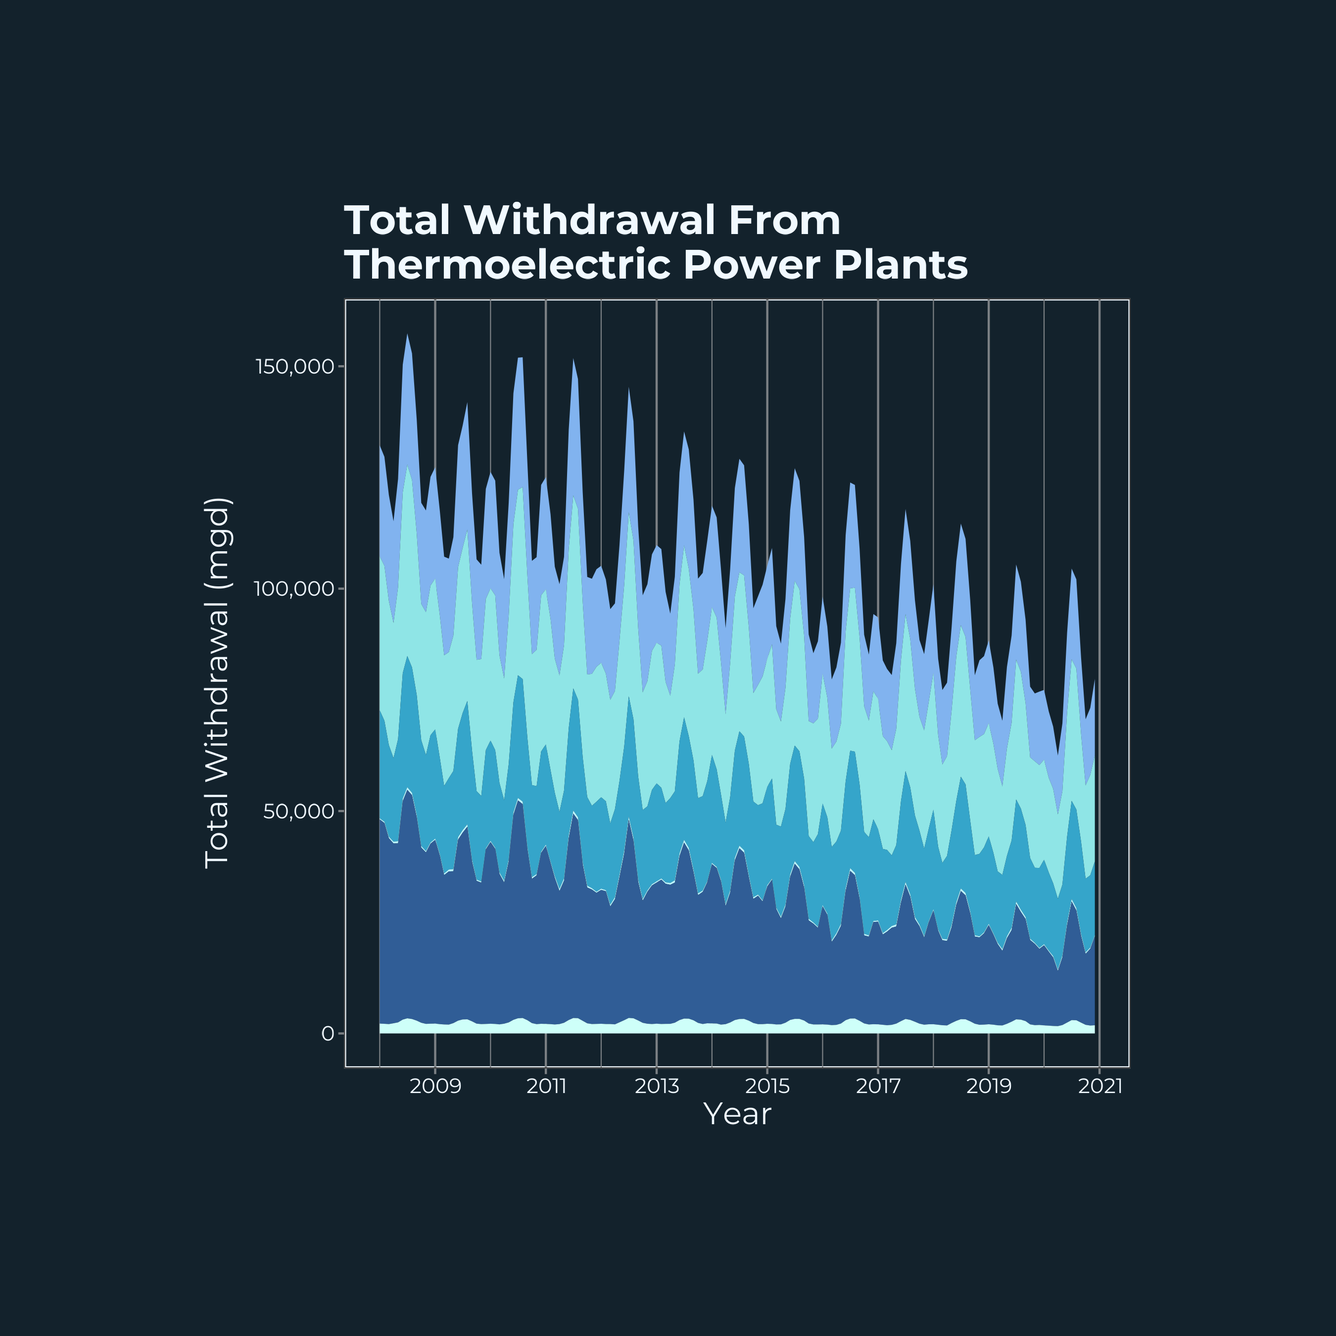
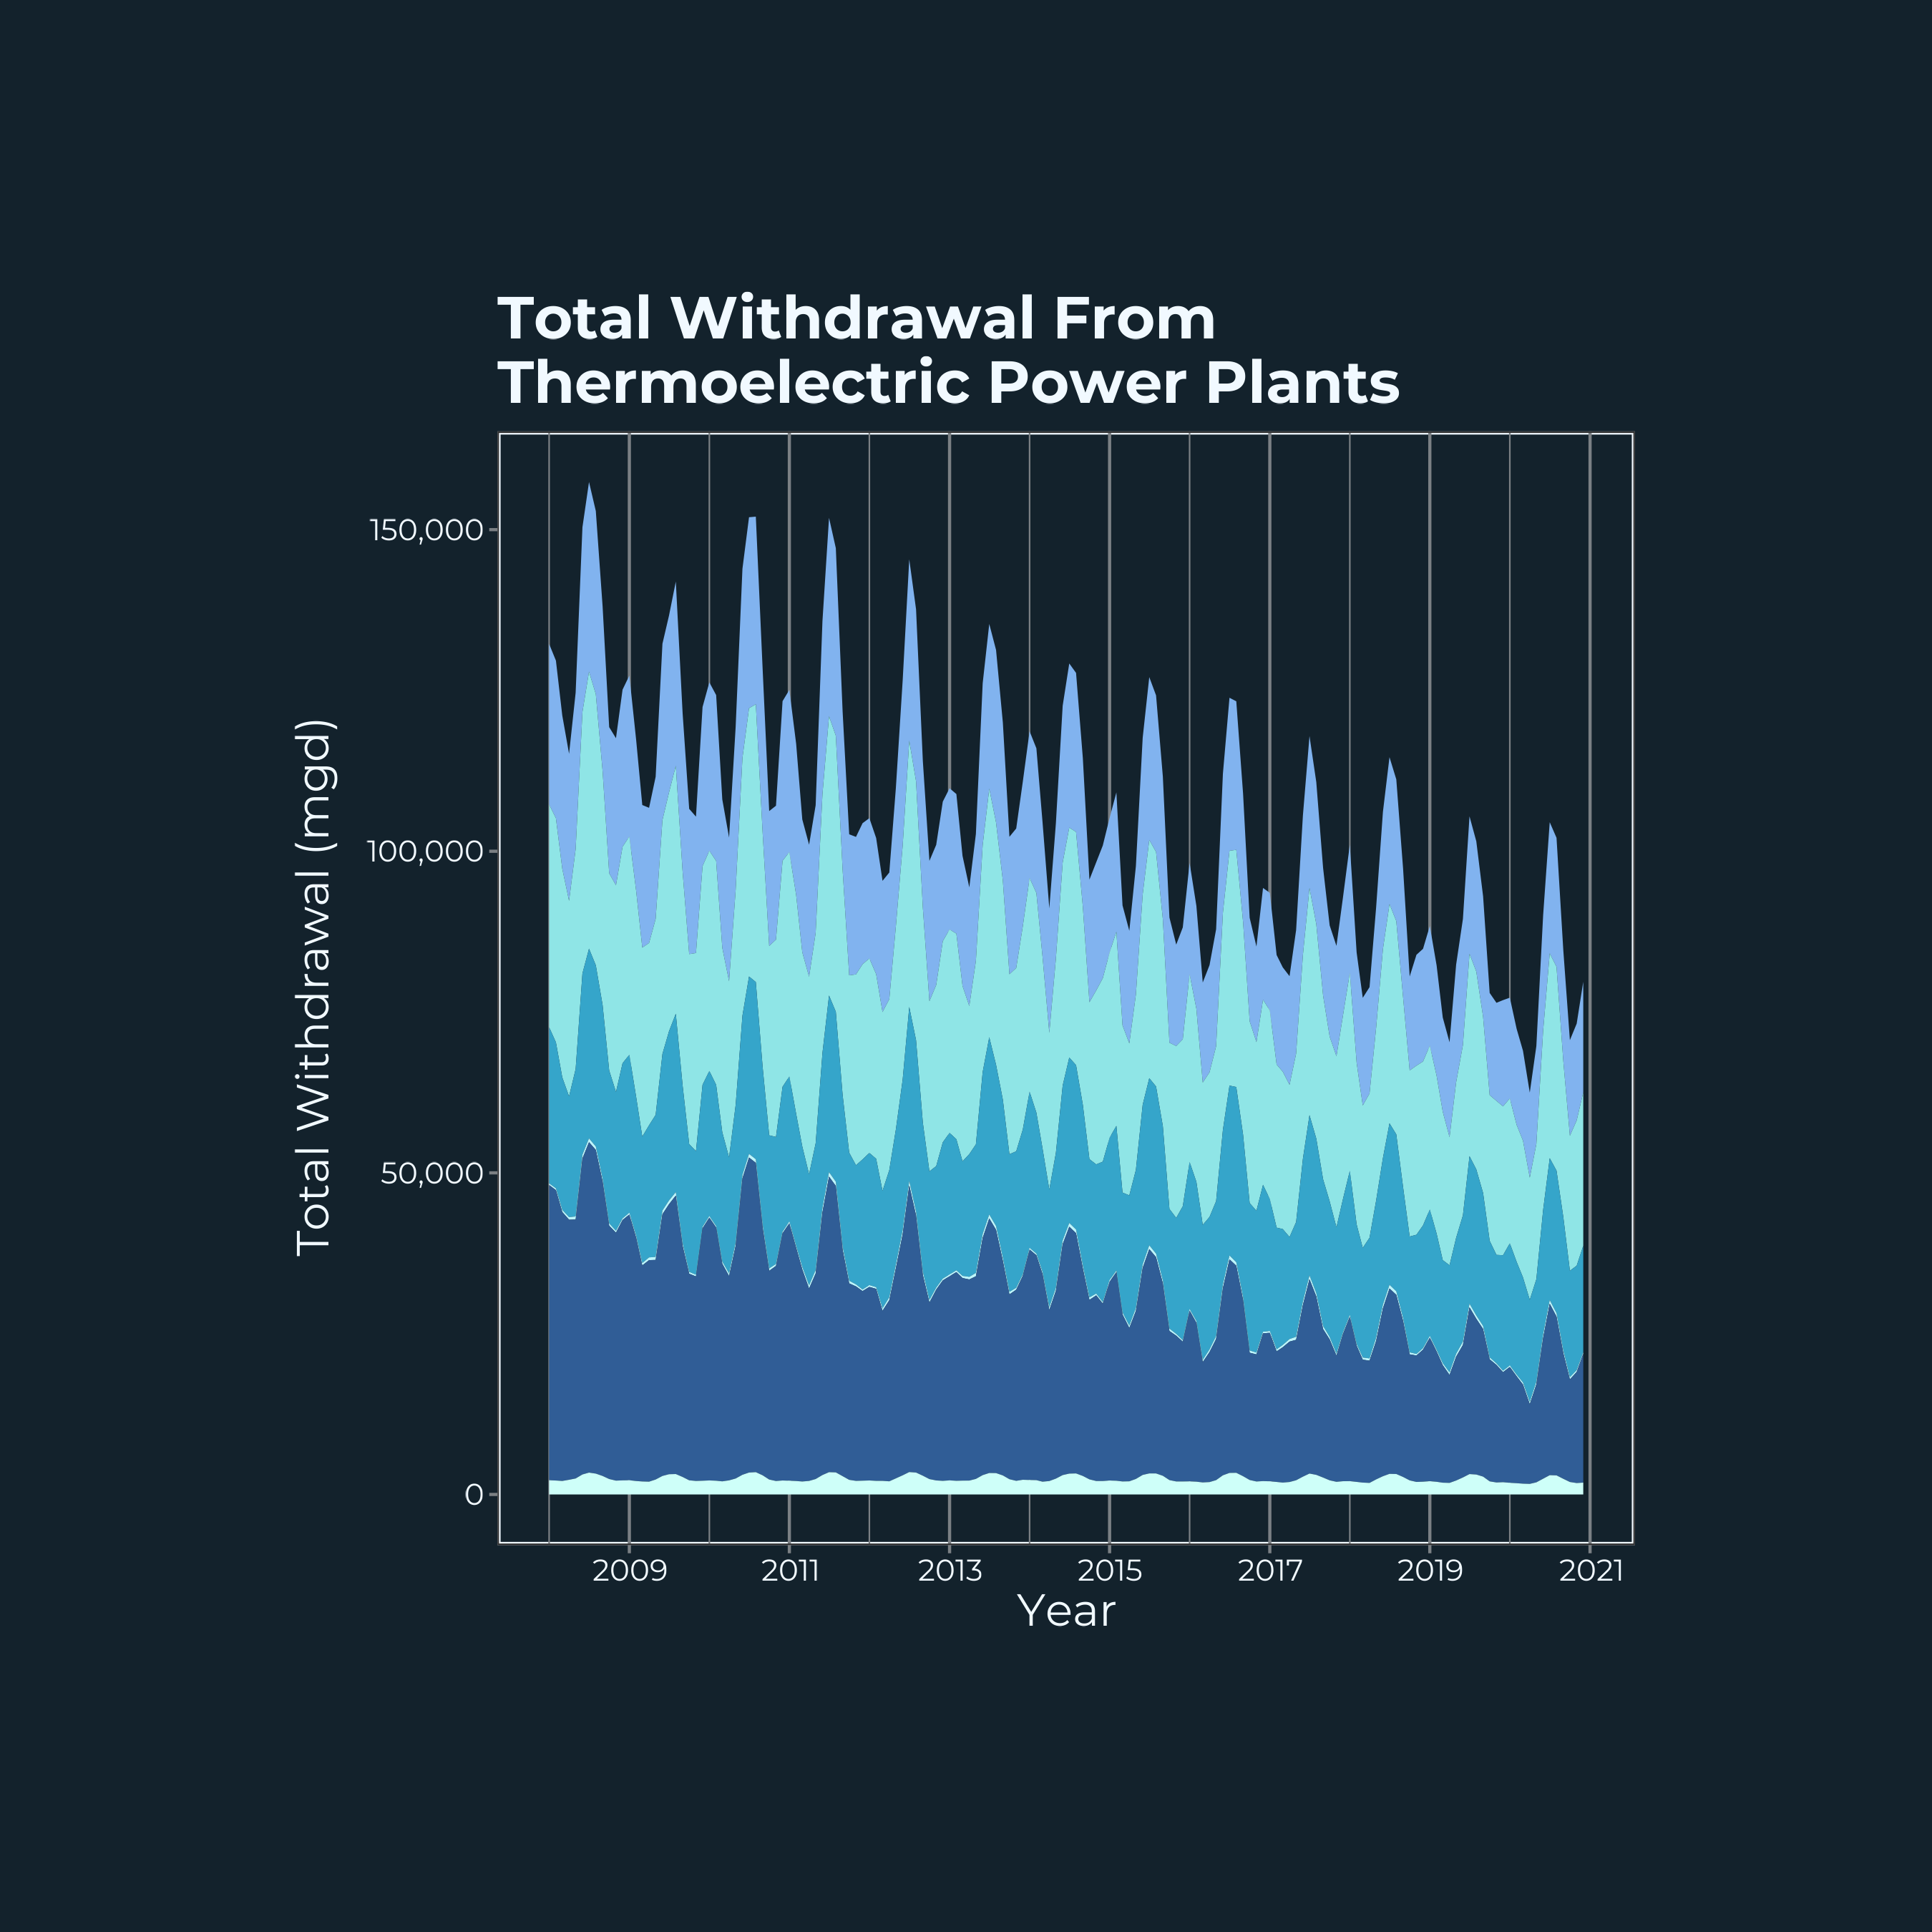
Stacked area chart showing total water withdrawal from thermoelectric power plants. Years on the x-axis, and withdrawal in million gallons per day on the y-axis. The data is split into 6 model types. Complex, lake, saline, pond, river, and tower. Withdrawal amounts vary during the year peaking during late summer and dipping during spring and early winter. Across years there is an overall decrease in total withdrawal.
Sources/Usage
Public Domain.