
Time series of water-level measurements made during Hurricane Isaac
By St. Petersburg Coastal and Marine Science Center
2012 (approx.)
Detailed Description
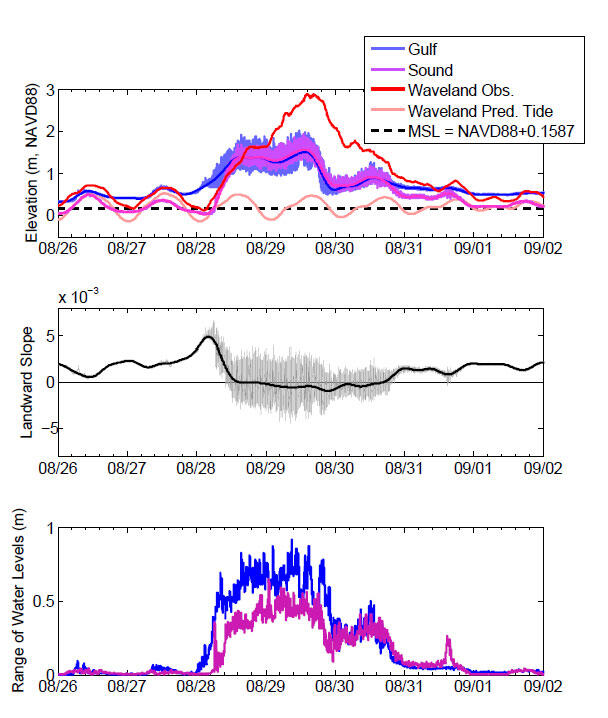
Time series of water-level measurements made during Hurricane Isaac in late August, 2012. Top panel shows water-level measurements in shallow wells placed in the beach 143 m apart on either side of the island in the northern Chandeleur Islands (eastern Gulf of America measurements in blue, western Chandeleur Sound measurements in purple. Also shown are observed (red) and predicted (pink) water levels at the NOS Waveland Station WYCM6 – 8747437. Middle panel is the water surface slope across the island, positive from Gulf to Sound (east to west). Low-pass filtered slopes are shown in thick black lines, unfiltered in light-gray. Bottom panel: maximum range of water surfaces during running 20-min intervals.
Sources/Usage
Public Domain.
Related

Barrier Island Evolution - Numerical Modeling and Oceanography
Numerical models compliment the collection of geophysical data by hindcasting and forecasting sediment transport pathways, natural island trajectories, and berm/island interactions over larger and higher resolution domains and time periods.
Related
Barrier Island Evolution - Numerical Modeling and Oceanography
Numerical models compliment the collection of geophysical data by hindcasting and forecasting sediment transport pathways, natural island trajectories, and berm/island interactions over larger and higher resolution domains and time periods.