TNMCorps_Newsletter_Vol08Iss01_ChartMappingChallengeCounts
Detailed Description
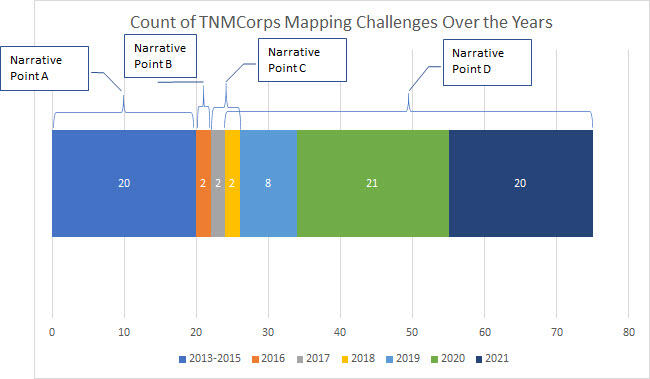
Figure X: A bar chart showing the number of mapping challenges that TNMCorps volunteers completed each year from 2013 to 2021.
Sources/Usage
Public Domain.

Official websites use .gov
A .gov website belongs to an official government organization in the United States.
Secure .gov websites use HTTPS
A lock () or https:// means you’ve safely connected to the .gov website. Share sensitive information only on official, secure websites.
Figure X: A bar chart showing the number of mapping challenges that TNMCorps volunteers completed each year from 2013 to 2021.
Public Domain.