
Trends in population and freshwater withdrawals by source, 1950–2015
By Water Resources Mission Area
2018 (approx.)
Detailed Description
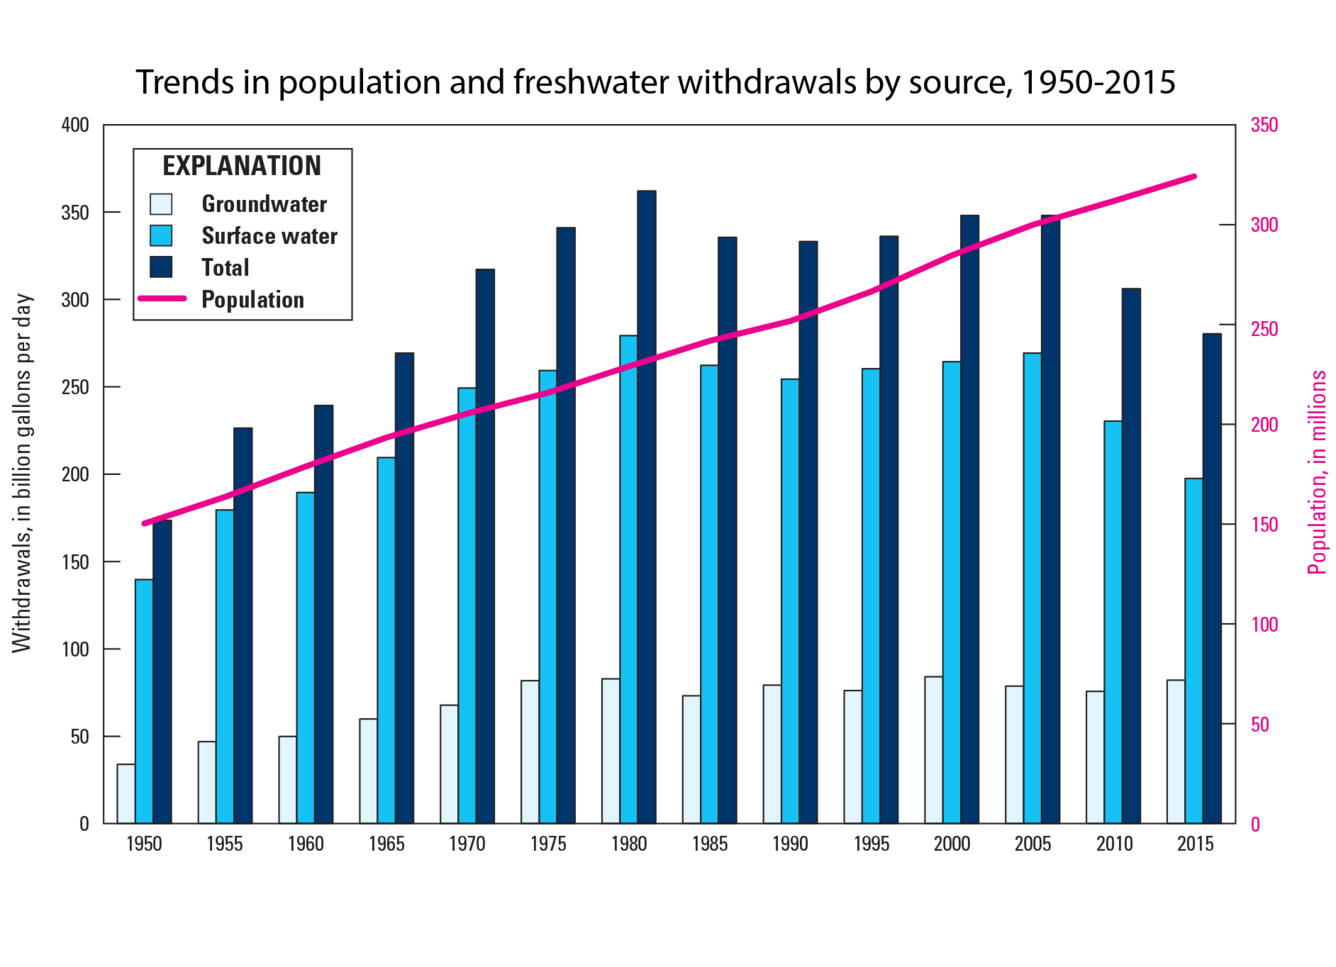
Trends in population and freshwater withdrawals by source, 1950–2015
Sources/Usage
Public Domain.
Related

Trends in Water Use
Total withdrawals for all categories of use in 2015 were estimated to be 322 billion gallons per day (Bgal/d), a level of withdrawal not reported since before 1970. Total withdrawals in 2015 were 9 percent less than in 2010, continuing a sharp but steady downward trend since 2005. Freshwater withdrawals were also 9 percent less than in 2015.

Surface Water Use in the United States
The Nation's surface-water resources—the water in the nation's rivers, streams, creeks, lakes, and reservoirs—are vitally important to our everyday life.
Related
Trends in Water Use
Total withdrawals for all categories of use in 2015 were estimated to be 322 billion gallons per day (Bgal/d), a level of withdrawal not reported since before 1970. Total withdrawals in 2015 were 9 percent less than in 2010, continuing a sharp but steady downward trend since 2005. Freshwater withdrawals were also 9 percent less than in 2015.
Surface Water Use in the United States
The Nation's surface-water resources—the water in the nation's rivers, streams, creeks, lakes, and reservoirs—are vitally important to our everyday life.