
Tucson Inversion
Detailed Description
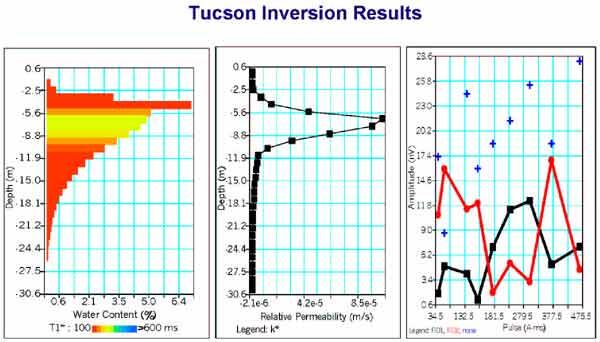
The graphs show, from left to right: water content and T1 decay time, in percent, with depth; relative permeability in meters per second, with depth; and the change in amplitude of the signal with time.
Sources/Usage
Public Domain.