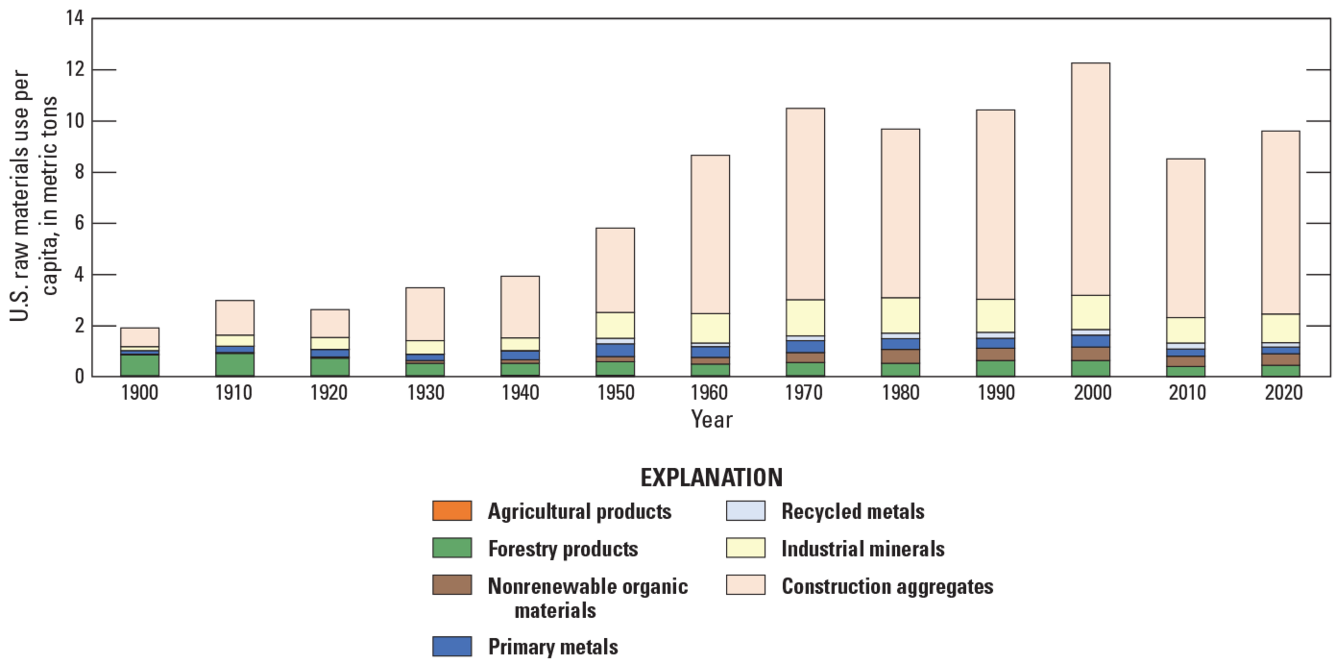
U.S. raw materials use per capita. in metric tons
Detailed Description
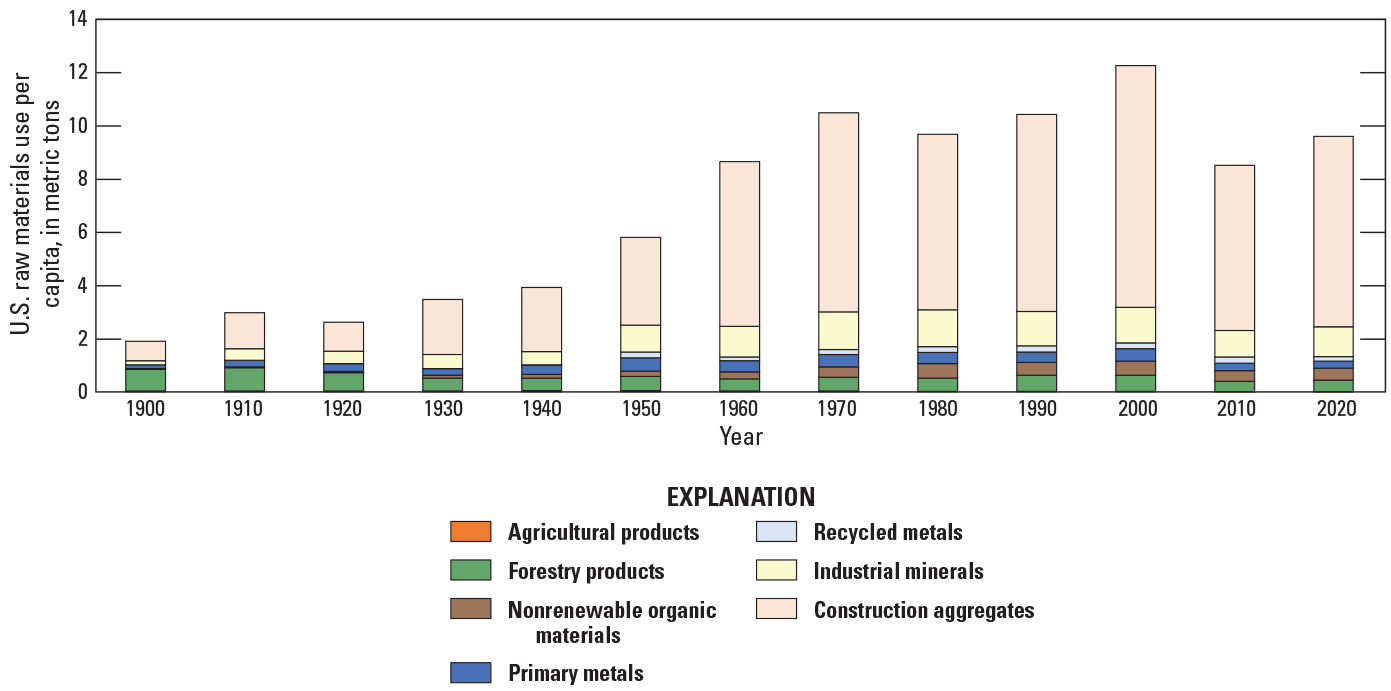
Figure 3 of Materials flow in the United States—A global context, 1900–2020, a graph of raw materials use per capita..
Sources/Usage
Public Domain.

Official websites use .gov
A .gov website belongs to an official government organization in the United States.
Secure .gov websites use HTTPS
A lock () or https:// means you’ve safely connected to the .gov website. Share sensitive information only on official, secure websites.
Figure 3 of Materials flow in the United States—A global context, 1900–2020, a graph of raw materials use per capita..
Public Domain.