



Water Data Viz Visualizing Water Use by Region and Time
Detailed Description
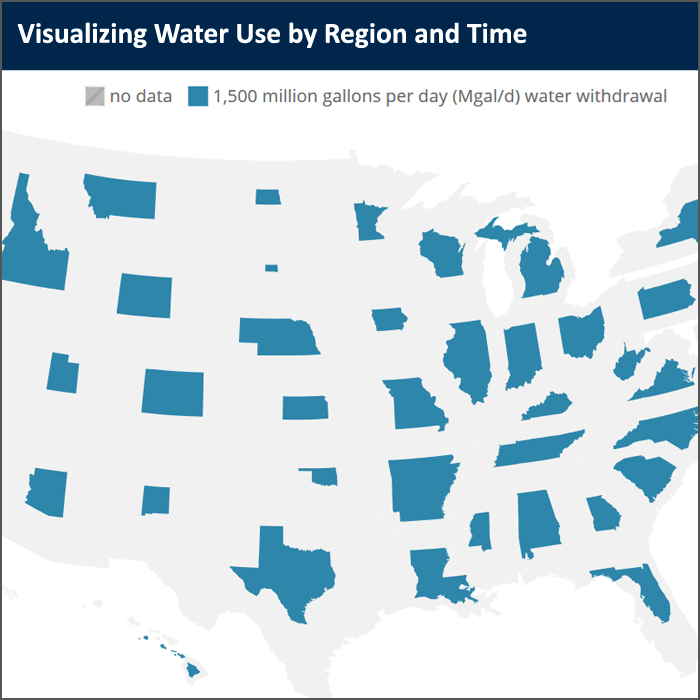
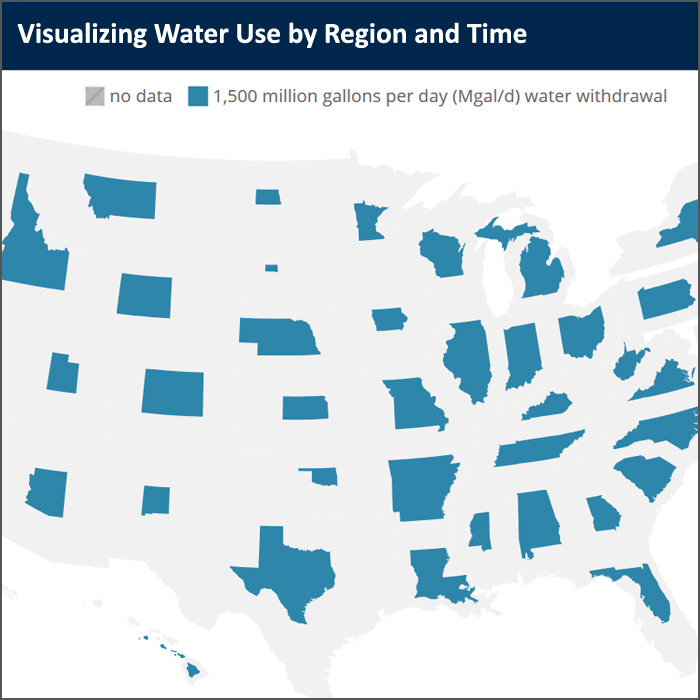
Water use data has been collected and compiled by the USGS since 1950. This data has changed over time in terms of how it was categorized and at what spatial scale it was summarized to. This visualization shows that change over time as this dataset has become more powerful, and attempts to illustrate where the data can go in the future to be a more useful dataset going forward.
Sources/Usage
Public Domain.