
Water supply vs demand
By Water Science School
June 2025 (approx.)
Detailed Description
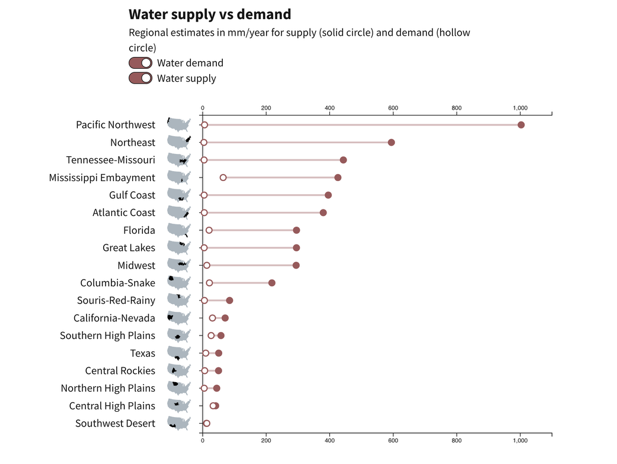
The average annual water supply (solid circle) and demand (hollow circle) in millimeters per year from 2010 to 2020. Data are shown by hydrologic region.
Image from: https://water.usgs.gov/vizlab/water-availability/
Sources/Usage
Public Domain.