
Water use map (2020)
Detailed Description
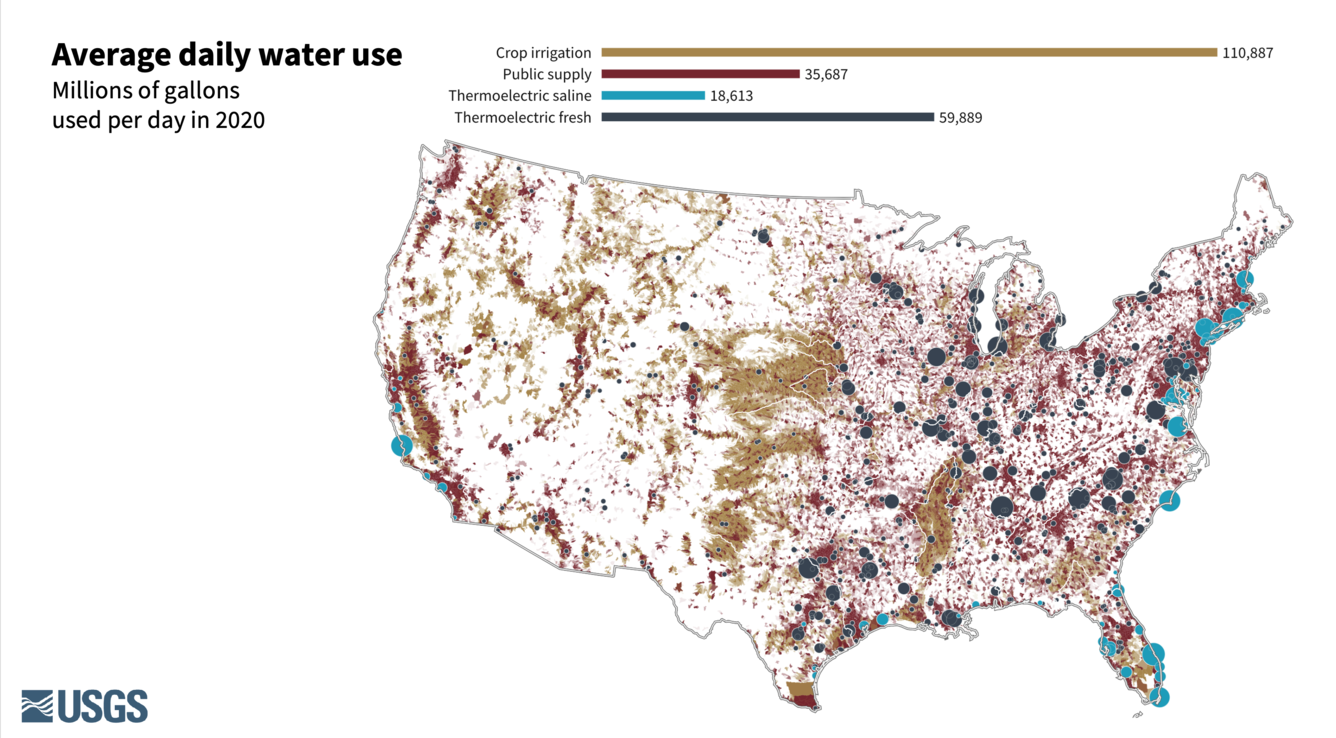
Average daily water use for the top 3 water use categories in the lower 48 states: thermoelectric power generation, public supply, and crop irrigation.
This map shows the distribution of modeled water use by category for each watershed (HUC12) in the lower 48 United States. Crop irrigation and public supply are shaded by daily withdrawal for each watershed. The thermoelectric points are scaled to represent daily withdrawals for each watershed where thermoelectric water withdrawal occurs.
Sources/Usage
Public Domain.