Chesapeake Bay 2014-2023 Per Acre Loads
Detailed Description
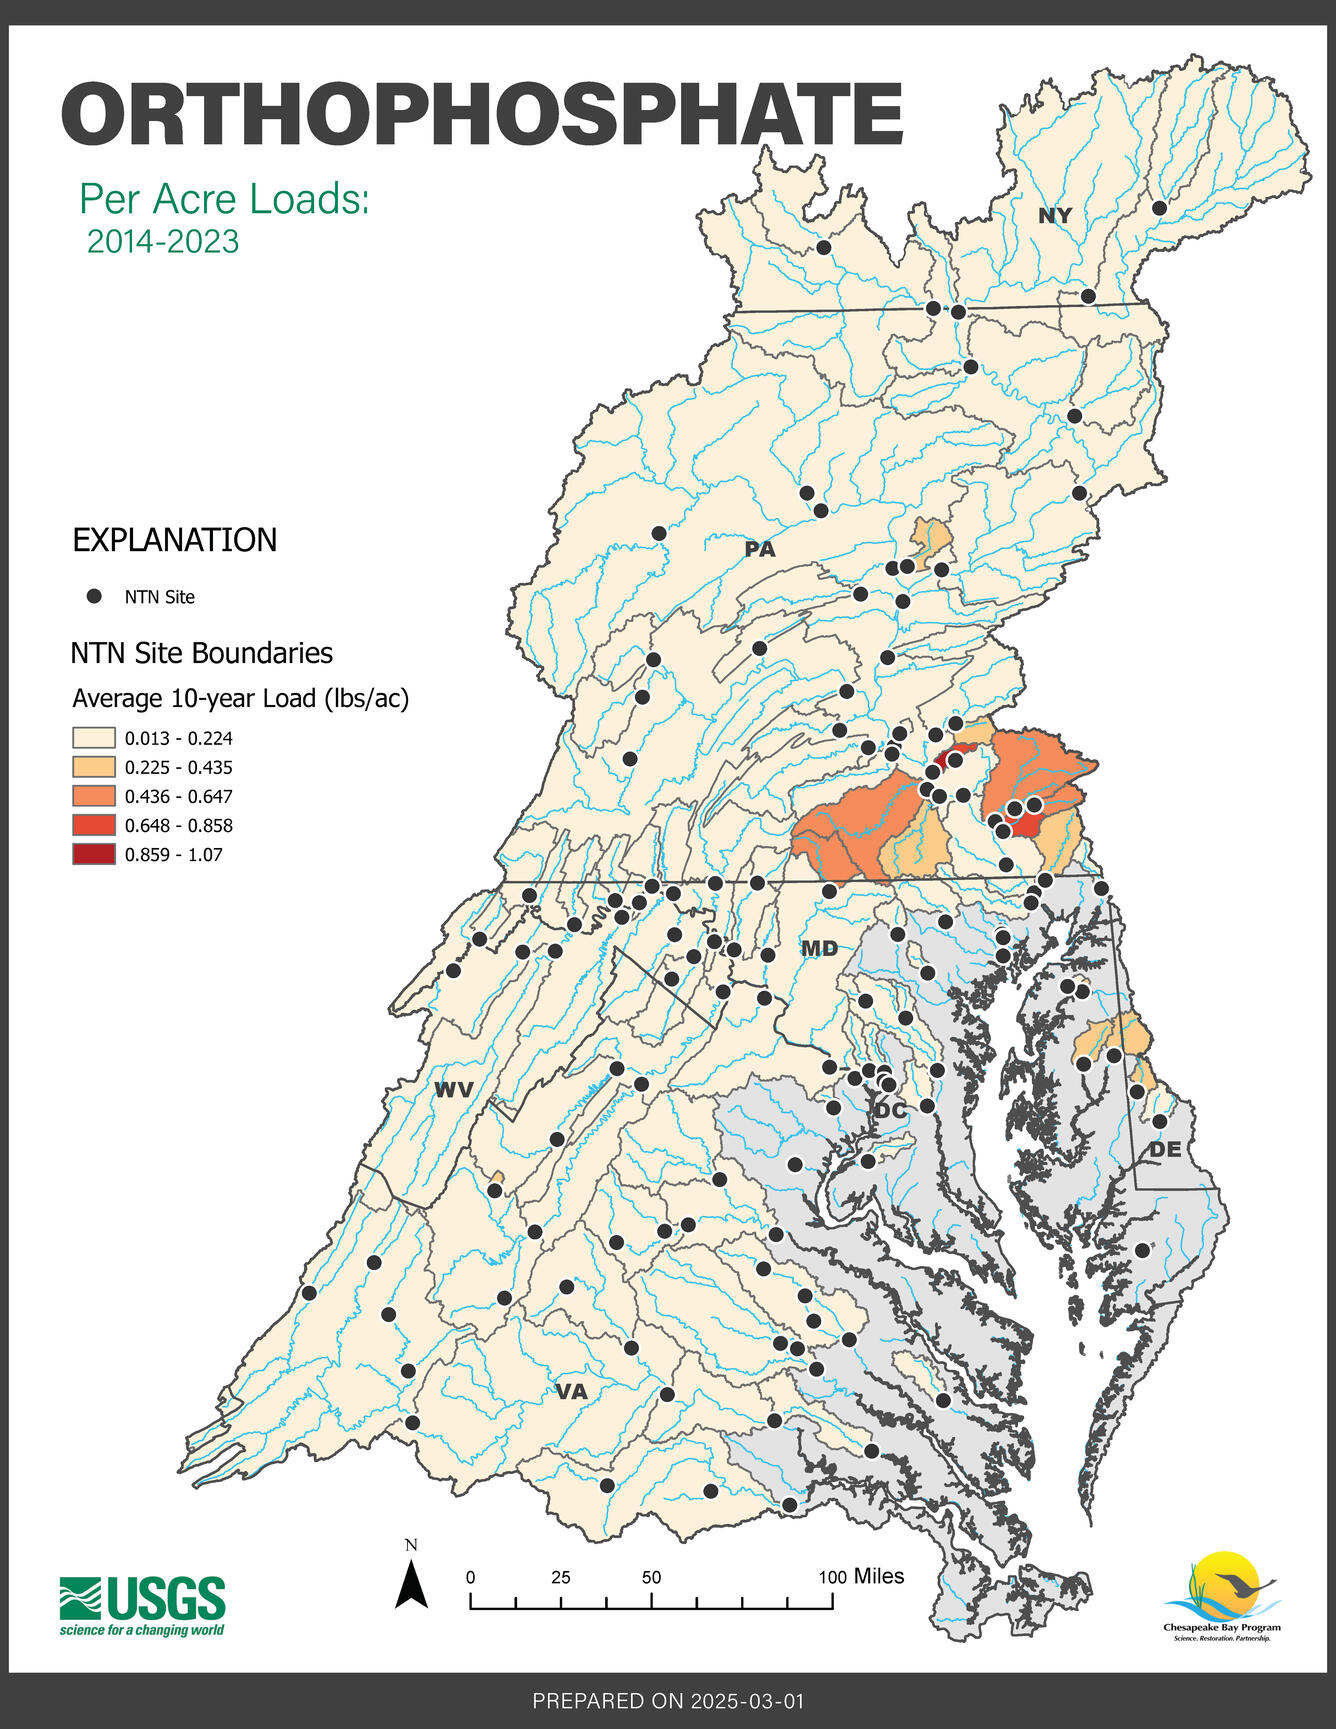
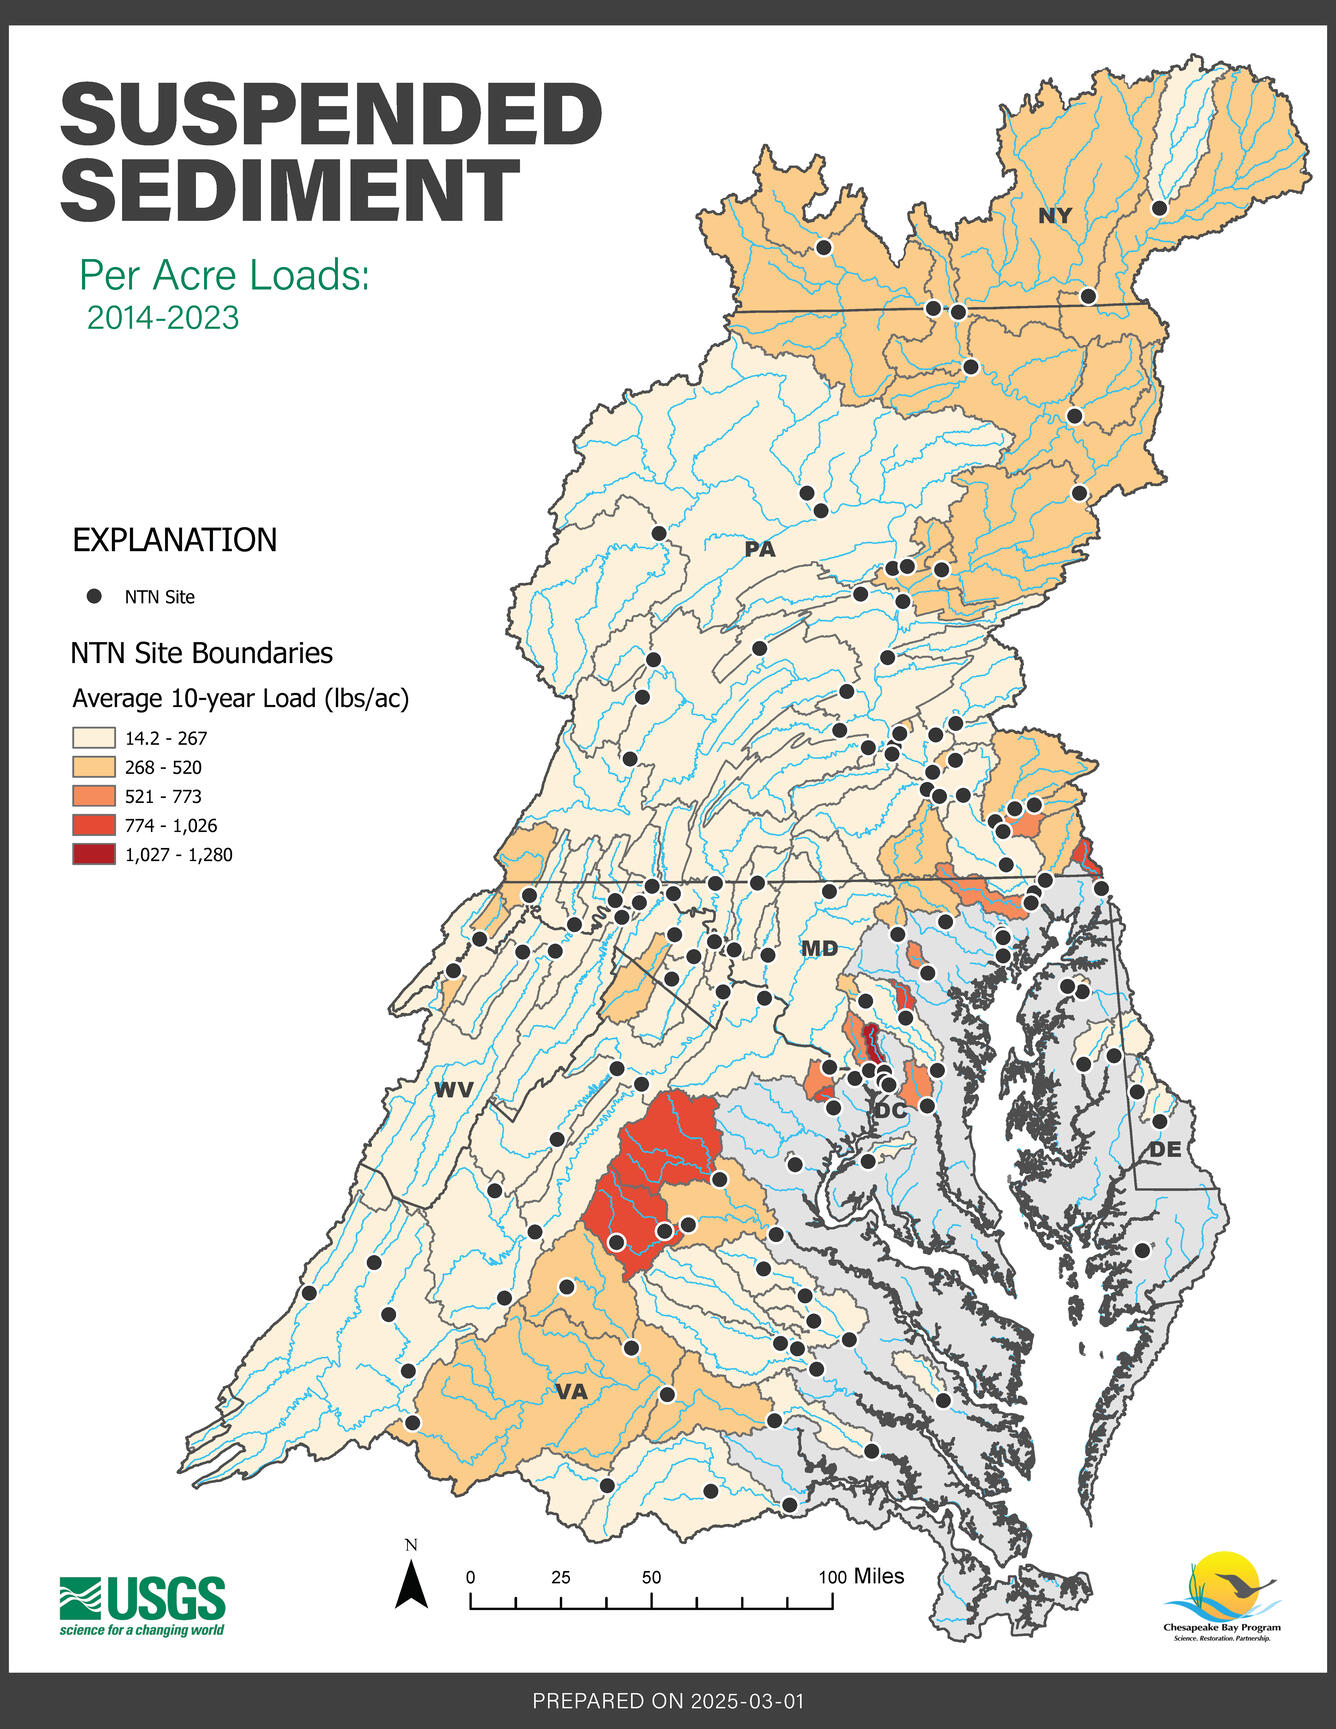
These maps display the average 10-year per acre loads of nutrients and sediment across the Chesapeake Bay Watershed from 2014 to 2023.
Loads are defined as the mass of nutrient or sediment passing a monitored location per unit time. A per-acre load, also known as a yield, is load divided by the area of the watershed upstream of the monitored location.
Learn more about Chesapeake Bay Water-Quality Loads and Trends and the USGS Nontidal Network.
Sources/Usage
Public Domain.
Related
View and Download Individual Maps
Chesapeake Bay Nontidal Network: 2014-2023 Nitrate + Nitrite Average 10-year Per-Acre Load
Chesapeake Bay Nontidal Network: 2014-2023 Total Phosphorus Average 10-year Per-Acre Load
Chesapeake Bay Nontidal Network: 2014-2023 Orthophosphate Average 10-year Per-Acre Load
Chesapeake Bay Nontidal Network: 2014-2023 Suspended Sediment Average 10-year Per-Acre Load
Chesapeake Bay Nontidal Network: 2014-2023 Total Nitrogen Average 10-year Per-Acre Load