3D Images of Magma Below Mono Craters Area
A new conceptual model of the magma system below Mono Lake and Mono Craters in eastern California gives scientists a more detailed understanding of volcanic processes at depth, and a better model for forecasting volcanic unrest.
A new conceptual model of the magma system below Mono Lake and Mono Craters in eastern California gives scientists a more detailed understanding of volcanic processes at depth, and a better model for forecasting volcanic unrest.
The Mono Craters volcanic area is ranked among the nation’s high threat volcanoes. Recent eruptions at Mono Craters occurred about 600 years ago at Panum Crater, and about 350 years ago on Paoha Island in the middle of Mono Lake. The accuracy and high resolution of the new three-dimensional images of the magma chambers and volcanic “plumbing” below Mono Basin give scientists a better understanding of their size, shape and where the next eruption might occur.
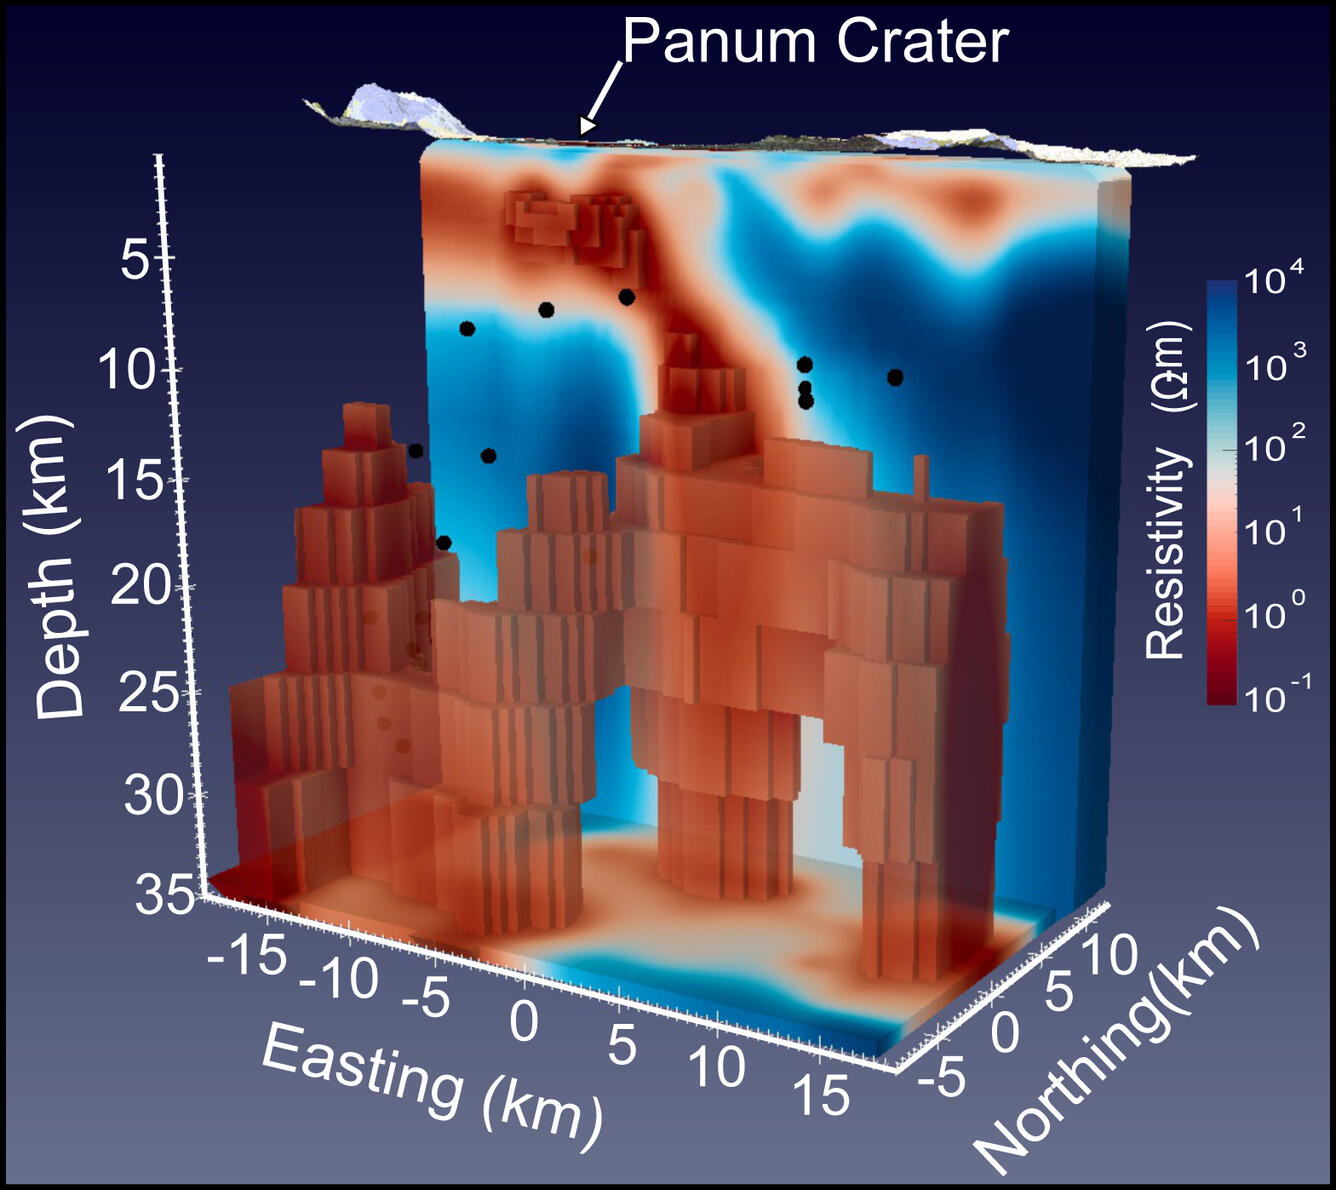
To create the new 3D images, U.S. Geological Survey post-doctoral researcher Jared Peacock used a technology called magnetotellurics. The technology measures slight electrical currents naturally created by the movement of ions in the Earth’s magnetic field (like the Aurora Borealis, or Northern Lights). The flow of these electrical currents through rock varies based on its composition and other properties. Old, dense rocks at depth are more resistant to electricity flowing through them, whereas fractured rocks containing fluids such as ground water, or hydrothermal fluids related to volcanic activity are less resistant. Magma chambers with liquid, melted rock, or a partially crystallized “mush,” have a very low resistivity to current flow.
The 3D resistivity images show at least two vertical magma columns 10 km (6 miles) deep. One column underneath Panum Crater, resembling the shape of a giraffe’s neck, veers off horizontally, suggesting the presence of hydrothermal fluids near the surface. The other column, below South Coulee, gives no indication of recent near-surface activity. An older body of granitic rock, a pluton, was also discernable amid the columns of younger magma in the 3D imaging.
Using the electrical resistivity model and data from previous scientific studies of the area, Peacock was also able to shed light on a long-standing question of how the volcanic system may be related to nearby faults. Peacock observed a conductive anomaly west of Mono Craters that has been known as a site of long-period earthquakes. This correlation could be caused by either volcanic fluids from magma moving below the surface, or the release of fluids from nearby metamorphic rocks that are under high pressure and temperatures. More research needs to be done in that area to determine whether the cause of the long-period earthquakes is due to magmatic (volcanic) or metamorphic processes. A determination could give insight to the possibility of future volcanic activity in a new area. The resistivity imaging also indicated how other small faults on the east side of the Sierra Nevada may be connected at depth, and extend farther and deeper than previously known.
“These new 3D images add detail to our existing knowledge of the volcanic system east of the Sierra Nevada, and enable us to make more accurate forecasts of volcanic unrest,” said Margaret Mangan, Scientist-in-Charge of the USGS California Volcano Observatory.
Peacock’s research paper, “Imaging the magmatic system of Mono Basin, California with magnetotellurics in three-dimensions,” has been accepted for publication in the Journal of Geophysical Research – Solid Earth, is available online.