USGS Crews Work Fast to Capture Ida Critical Flooding Measurements
To learn more about USGS’s role providing science to decision makers before, during and after Ida, visit https://www.usgs.gov/Ida
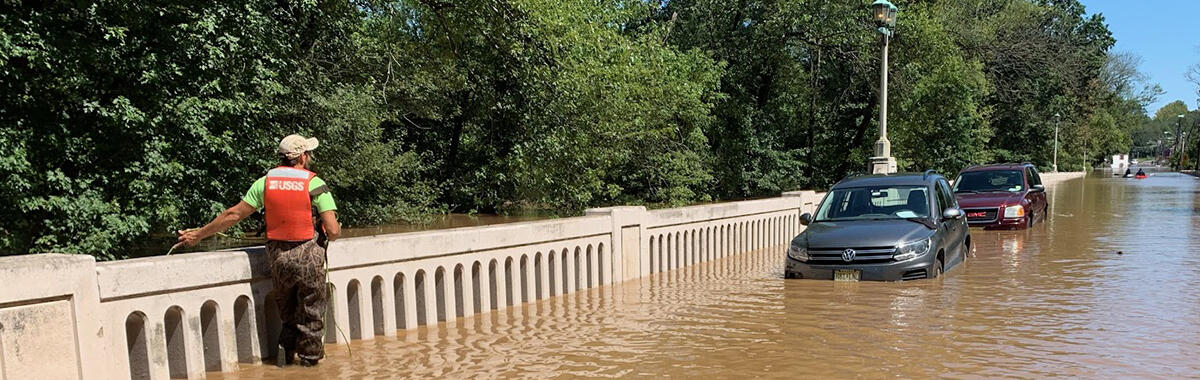
Five days after Hurricane Ida made landfall, leaving behind catastrophic flooding and significant damage in its path, U.S. Geological Survey scientists started quickly working a multi-week effort to capture high-water mark elevations in some of the most impacted areas. Teams from USGS water science centers in New York, New Jersey, Pennsylvania, and Maryland are working together to preserve, document, and survey elevations of more than 200 combined high-water marks left from flooding caused by Ida’s heavy rains.
“We are working with federal and state partners, along with the New York City mayor's office to coordinate our high-water mark collection effort in the hardest-hit communities of New York City,” said Ronald Busciolano, a supervisory hydrologist at the USGS New York Water Science Center. “Our marks will provide ground-truth to other ongoing mapping efforts and be used by emergency managers to define the extent and depth of flooding in impacted areas, which decision-makers can use as they work to protect their communities from future flooding."
The locations were assigned to the USGS with guidance from the Federal Emergency Management Agency, National Weather Service, U.S. Army Corps of Engineers, river basin commissions, and emergency management officials. One hundred marks will be recorded in New York and 50 in New Jersey. The Pennsylvania and Maryland crews will record 75 and 33 locations respectively in southeastern and central Pennsylvania and northern Maryland.
The USGS experts are looking for telltale lines of seeds, leaves, grass blades and other debris left behind on buildings, bridges, other structures, and even tree trunks as floodwaters recede. Once they find these high-water marks, they label them, photograph them, survey them, and record crucial details about them. The physical signs of flooding provide valuable information that can confirm or correct other lines of evidence.
High water mark campaigns, coupled with stream and flood measurements, provides a more complete picture of storm impacts.
In New Jersey, deadly flooding impacted areas from the western edge along the Delaware River to the east and northeast, setting new peak streamflow records at streamgages in Princeton, Ridgewood, and Elizabeth, New Jersey. In total, about 12 USGS streamgages recorded new period-of-record flood peaks, and an additional 10 streamgages came close to equaling or exceeding the current peaks of record. In Pennsylvania, at least 14 streamgages recorded the highest peaks of record, most of which were in and around the Philadelphia area.
The peak streamflow recorded at these USGS streamgages will be used to update previously computed flood frequencies. Flood frequency analysis is used to estimate the magnitude of floods, which helps inform decisions on the appropriate design criteria for bridges and roads, and with flood-plain management, among other things.
“In addition to collecting high-water marks and streamgage measurements, the USGS Pennsylvania Water Science Center also deployed six storm sensors in and around Paxton Creek in Harrisburg in advance of the storm,” said Marla Stuckey, a hydrologist at the center. “This data will provide flood elevation data to help determine the extent of flooding.”

The USGS has thousands of real-time water-monitoring sites throughout the nation that record continuous stream stage (height of a river) and streamflow (how much water is flowing). This network of streamgages is invaluable during floods and high water to allow the general public and emergency responders to know where dangerous flooding might be occurring.
The USGS’s early information from streamgages and high-water marks can help emergency managers see areas hardest hit by flooding, helping them make informed decisions on issues ranging from evacuation routes to where to locate relief centers so that aid can reach the most severely affected communities quickly. The information can help the U.S. Army Corps of Engineers manage flood control.
The fieldwork is expected to continue for the next several weeks and will help FEMA to discern the difference between wind and water damage – important information for property owners and insurers. Over the long term, it can help emergency managers plan better for future floods; improve the computer models used by the National Weather Service to forecast flooding; provide information used by FEMA to update the nationwide flood zone maps that underpin the federal flood insurance program. Data will be available on the USGS Flood Event Viewer.