
Volcano Watch — HVO transforms stacks of paper earthquake records into digital squiggles
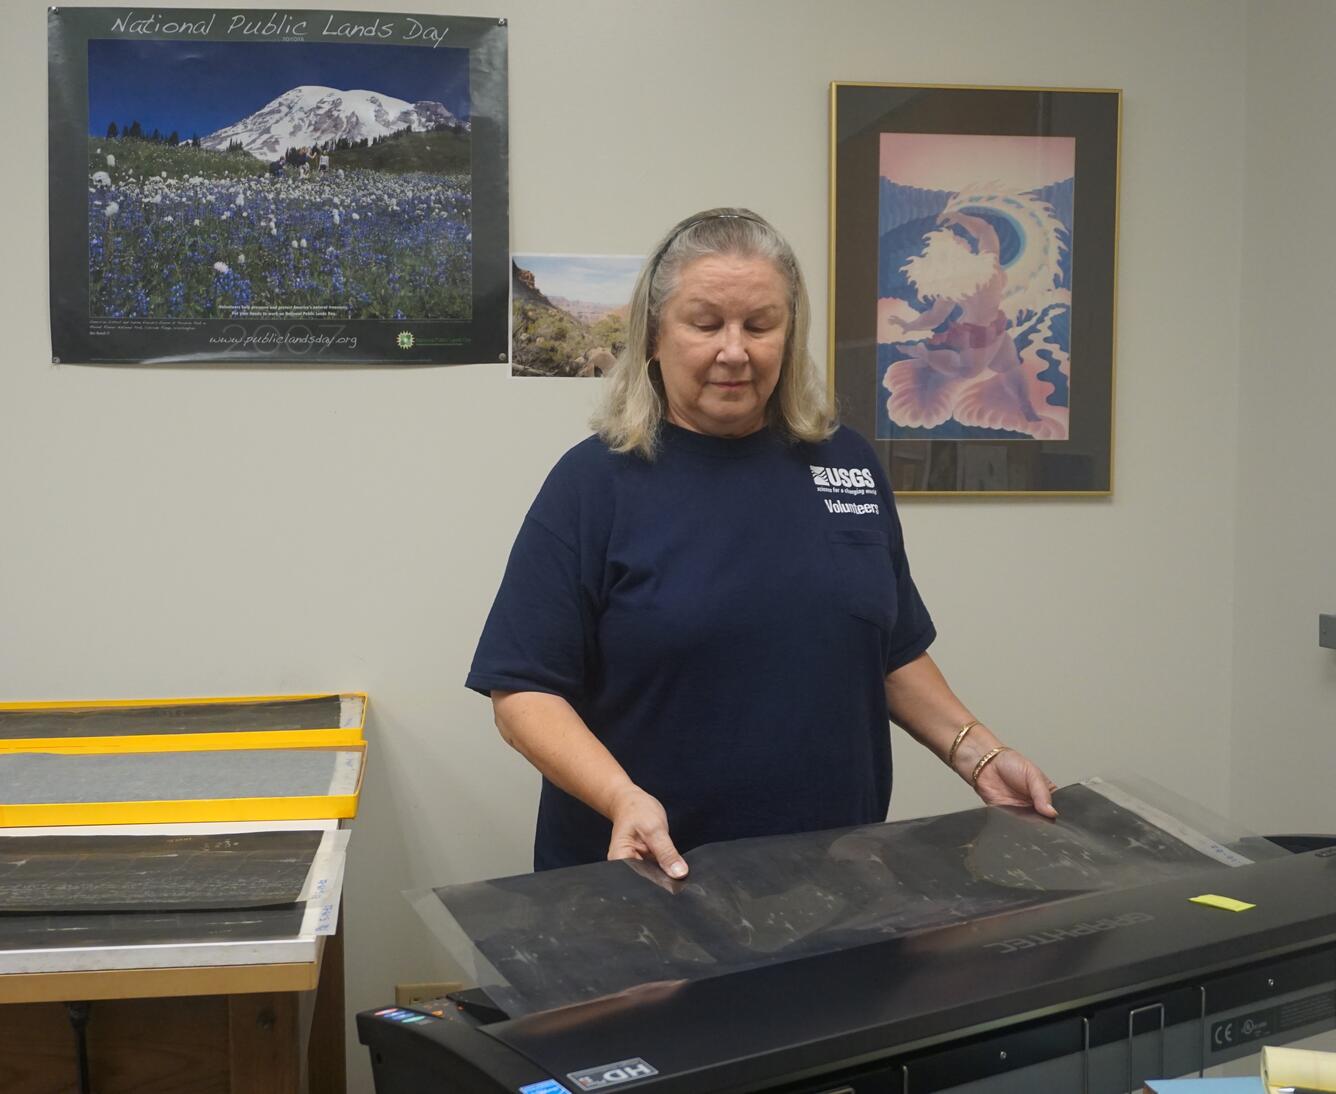
With funding from USGS data rescue initiatives, HVO scanned seismograms from a number of significant earthquakes and seismic sequences. Since last summer, volunteer Marcy Frenz has enthusiastically and diligently assumed scanning duties at HVO, working through the 1974–1984 interval spanning Mauna Loa Volcano's two most recent eruptions.
Seismology is often thought of as "earthquake science" because earthquakes—while not the only cause—are the most prolific producers of seisms, or earth shaking. The largest earthquakes ever recorded release many thousands of times more energy than the largest man-made explosions.
Continuous and systematic study of volcanic and related earthquake activity began at the Hawaiian Volcano Observatory (HVO) in 1912, when Professor Thomas Jaggar put his first seismographs into operation in HVO's Whitney Laboratory. He purchased and installed these instruments to record the shaking produced by Hawai‘i's active volcanoes and frequent earthquakes.
Through the early 1900s, led by Jaggar and other geological pioneers, seismic monitoring gradually spread around the world into areas known for earthquake and volcanic activity. During roughly this same time, mathematicians were developing the theoretical underpinnings of seismic wave generation and propagation.
At HVO, the seismic waves were initially recorded by a stylus that etched its squiggly trace into a layer of kerosene soot that coated glossy paper wrapped around the seismograph's slowly rotating drum. Through the next 100 years, the recording media changed from smoked or soot-coated papers to photographic, then heat-sensitive papers, and finally to pen-and-ink before paper recording was discontinued in 2013.
By then, HVO had moved to its fourth-generation of computer-based data acquisition, recording, and processing systems. In addition to automatically detecting and locating earthquakes, seismograms in digital format make it possible to more rigorously apply seismological theory toward a deeper understanding of seismic processes associated with active volcanoes.
With computer-based recording, adding stations or instruments is achieved with RAM, disk space, and clock-cycles. With paper recording, an additional instrument required an additional seismograph that produced another paper record per day. In the late 1960s, just as the U.S. Geological Survey began processing earthquake data in California on mainframe computers at Stanford University, the number of seismic paper records produced at HVO reached a peak of 30 per day. From 1912 to 2013, HVO collected nearly half-a-million paper seismograms.
HVO is by no means alone with its stacks upon stacks of paper seismograms. This is a common problem among seismic network operations, and the older the seismic network, the more records there are.
Creative storage solutions are sometimes exercised. The University of California's Berkeley Seismological Laboratory stored seismograms from their 100-year-old collection in the Campanile clock and bell tower at the center of the university's Berkeley campus.
The seismological community has long been striving to preserve historical seismograms for future researchers. Early efforts produced copies of seismograms on microfilm. Now, large-format digital scanners enable more groups to work through their stacks of paper seismograms and preserve them as digital image files.
With funding from USGS data rescue initiatives, HVO scanned seismograms from a number of significant earthquakes and seismic sequences. Since last summer, volunteer Marcy Frenz has enthusiastically and diligently assumed scanning duties at HVO, working through the 1974–1984 interval spanning Mauna Loa Volcano's two most recent eruptions.
Motivated by the opportunity to renovate and upgrade their seismographic station, seismologists at Harvard University recovered and scanned records collected from 1933 to 1953. They also wrote a computer program that digitizes or extracts digital seismic traces from the squiggles captured by the scanner.
Our Harvard colleagues have generously shared their program with HVO. As we build up our collection of scanned and digitized historical seismograms, we look forward to exploring data recovered from these seismograms with analytical tools used on current and recent data that track changes in seismic wave properties within the volcanoes.
Volcano Activity Update
This past week, Kīlauea Volcano's summit lava lake level fluctuated in concert with summit inflation and deflation, ranging 15–32 m (49–105 ft) below the vent rim. On the East Rift Zone, the 61g flow was still active, with lava entering the ocean near Kamokuna and surface breakouts downslope of Pu‘u ‘Ō‘ō. These flows do not pose an immediate threat to nearby communities. On May 3, the front section of the Kamokuna lava delta collapsed into the sea, a reminder that new land created by ocean entries is highly unstable and prone to collapse without warning.
Mauna Loa is not erupting. During the past week, small-magnitude earthquakes were recorded primarily beneath the upper Southwest Rift Zone at depths up to 5 km (3 mi), and the upper west flank at depths of about 7–8 km (4–5 mi). A magnitude-3.1 earthquake occurred in the upper Southwest Rift Zone on April 28. GPS measurements continue to show deformation related to inflation of a magma reservoir beneath the summit and upper Southwest Rift Zone. No significant changes in volcanic gas emissions were measured.
One earthquake was reported felt on the Island of Hawai‘i during the past week. On May 3, at 1:32 p.m. HST, a magnitude-3.2 earthquake occurred in 2.9 km (1.8 mi) south of Kīlauea's summit at 2.8 km (1.7 mi) depth.