



The power of geologic mapping: Getting to know volcanoes in California’s Long Valley
How do geologists uncover the secrets of California’s volcanoes? It all starts with geologic mapping!
The California Volcano Monitor is a weekly column written by scientists and collaborators of the California Volcano Observatory. This week's contribution is from Judy Fierstein, research geologist with the U.S. Geological Survey.
Topographic maps, familiar to many hikers, are used as the base of a geologic map. These show the contours and elevation of the landscape, as well as roads, trails, lakes, and peaks of an area. Geologic maps overlay rock types on the topography and use colors and patterns to show the location of different rock and sediment types, earthquake faults, mineral deposits, and other geologic features. Together, they reveal the story of the land and how it has changed through time.
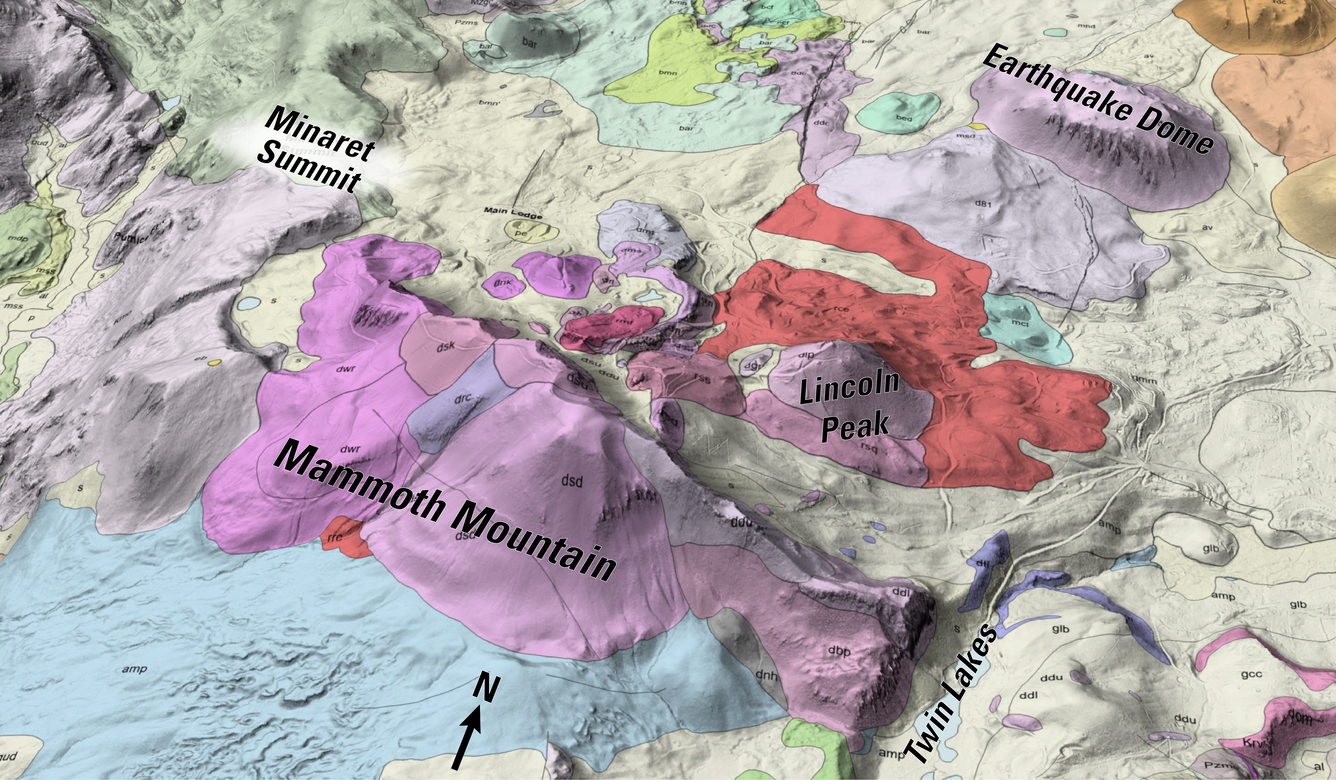
Each geologic map is a snapshot of discovery tailored to address specific scientific questions. New methods, finer instruments, a better understanding of how the earth works, and evolving societal priorities—all drive us to imagine and investigate new geologic questions. A century ago, the focus was on building the basic framework: What are the mountains made of? Where are the valuable minerals? Why are most volcanoes near the Pacific coast? In the 1950s, geologists mapped the Sierra Nevada’s ancient rocks and mineral deposits. In the 1960s, geologists recognized that thick ash deposits near Bishop, CA were from a very large volcanic eruption 767,000 years ago from Long Valley caldera. In the 1970s, geothermal energy promised partial relief from fossil-fuel dependence, so USGS studies in Long Valley turned to investigating hot subsurface groundwaters. Special instruments were used to probe beneath the ground surface, looking for shallow chambers of molten rock (magma) that could provide a heat source for geothermal energy. When earthquakes surged in Long Valley in 1980, mapping efforts pivoted again—this time toward understanding volcanic hazards and seismic risks in the area.
Today, the USGS California Volcano Observatory is focused on applying modern research techniques to understanding and monitoring volcanic and seismic hazards throughout California and Nevada. New technologies let geologists easily analyze the chemical makeup of the rocks and the individual crystals that form them. This geochemical fingerprinting helps distinguish between the many lava flows that look alike and makes it easier to map their distributions. New lab instruments let us use radioisotopes of Argon (and other elements) to precisely date the many lava flows that make up individual volcanoes. This helps us assemble a chronology of the number, frequency, size, and explosivity of past eruptions. The reports and maps we compile are a bit like a family medical record, which help us know what’s likely to happen the next time there’s a crisis.
Over the years, geologic mapping in California’s Long Valley region has highlighted a diversity of volcanic eruption styles and rock compositions. Basalt, which is fairly fluid and flows easily when it erupts, usually comes out in one-shot events that build scoria cones and extrude lava flows several miles long, like Red Cones a few miles south of Mammoth Mountain. Sometimes the magma doesn’t quite reach the surface but instead heats groundwater that flashes to steam and explodes, forming craters like the Inyo Craters, a few miles north of Mammoth Mountain. Dacite magma is more viscous and commonly doesn’t flow far from source, piling up lava around its vent and building a lava dome. Repeated eruptions of such viscous lavas over thousands of years built Mammoth Mountain, which is made up of 24 overlapping lava domes.

Rhyolite magma is ultra-viscous and traps volcanic gas, which depressurizes as it gets closer to the surface of the Earth. As it rises, the gas expands violently, exploding the magma into small bits of hot ash and pieces of pumice (frothed-up magma) that jet upwards in a gas-rich plume. When this happened at the Glass Creek vent of the Inyo Craters in 1350 A.D., so much pumice was expelled that it thickly covered much of Mammoth Mountain, 8 miles downwind. It smoothed out the mountain’s slopes, so much that it's now a world-class mountain-biking destination! The much larger rhyolite super-eruption of Long Valley Caldera evacuated so much magma from its underground storage that its roof collapsed into a hole 20 miles wide and 10 miles from north to south. Ash layers from that eruption are still found in Nebraska!
Figuring out these detailed geologic histories requires boots-on-the-ground fieldwork to determine the order in which lavas and other deposits were erupted and recording it all on the map. It is much more than drawing lines on a map, however— geologic mapping is a journey through time that builds an understanding of Earth’s dynamic processes. It is the foundational framework for all the rest of the geologic studies and interpretations that follow, including volcano hazard assessments and seismic, gas-emission, and geothermal studies. By piecing together the eruptive histories and chemistry of volcanoes and their eruptive products, geologists can better know what to expect in the future and help mitigate risks for communities and infrastructure.