



New Kīlauea summit eruption tephra map
The USGS Hawaiian Volcano Observatory produced a new map following a helicopter LiDAR survey of the ongoing Kīlauea summit tephra deposit and crater floor shortly after the end of lava fountaining episode 52 the morning of July 29, 2026.
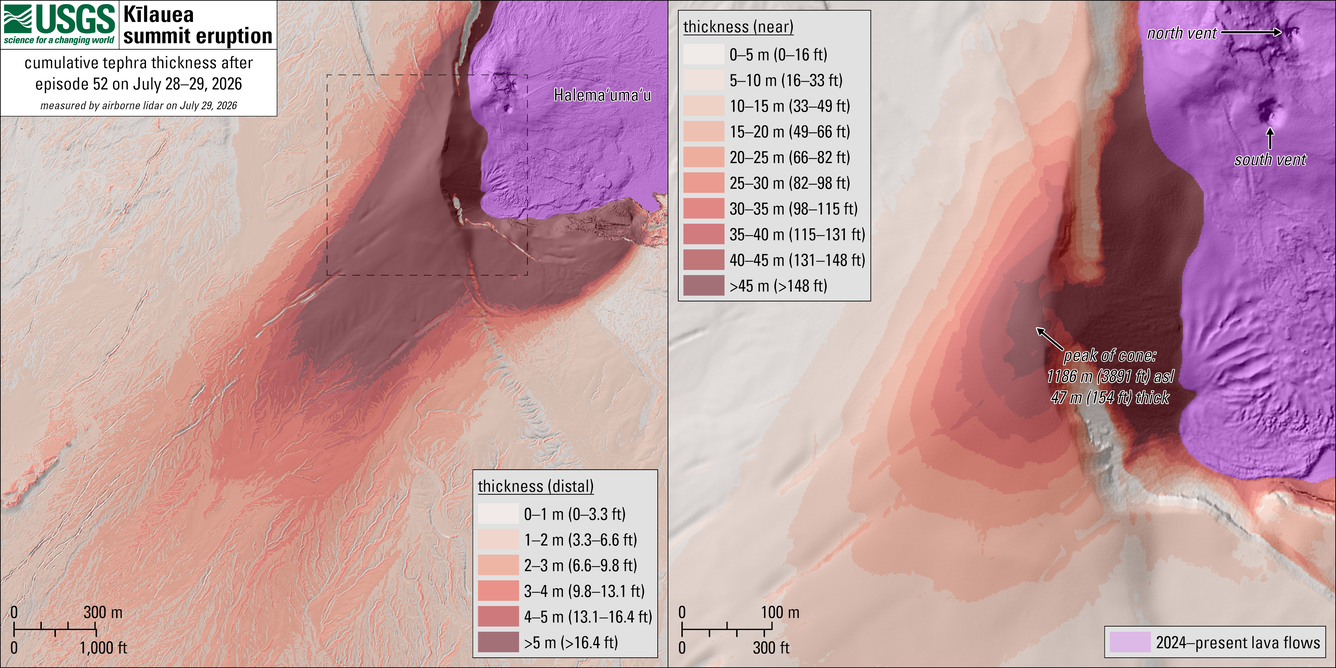
This map depicts cumulative tephra thicknesses for the Kīlauea summit eruption in areas southwest of the Halema‘uma‘u eruptive vents as of July 29, 2026. That day, the USGS Hawaiian Volcano Observatory (HVO) completed a helicopter LiDAR (Light Detection and Ranging) survey of the tephra deposit and crater floor shortly after the end of lava fountaining episode 52 the morning of July 29, 2026.
LiDAR provides high-resolution topographic data, with the ability to scan through clouds/gases and get returns from almost any possible surface texture. In these ways, lidar is an improvement over HVO's traditional photogrammetry method for modeling topography; to date, photogrammetry has been unsuccessful in modeling the tephra deposit due to its featureless surface and the constant presence of the eruptive gas plume in the area. However, LiDAR data are more difficult to collect and process, so these surveys are not conducted as often.
Data from the July 29 survey indicate the peak of the tephra cone on the western rim of Halema‘uma‘u crater reached a height of 1,186 meters (3,891 feet) above sea level, with a cumulative thickness of 47 meters (154 feet) based on the pre-eruption ground level at this location. Lava fountaining episodes 53 and 54 after this survey did not substantially alter the topography of the area, so the thickness values in this map should still be fairly representative as of its release on September 3, 2026. The left panel of the map uses a fairly narrow color band up to only 5 meters (16.4 feet), helping to show the distal tephra deposit stretching into the Ka‘ū Desert in Hawai‘i Volcanoes National Park. The right panel is zoomed on the tephra cone itself, with the color band extending up to 45 meters and greater to show the full range of thicknesses in the cone. In both panels, the colors are semi-transparent, as the digital elevation model from the same survey provides the basemap.