



The USGS Library Celebrates 250 Years of Discovery and Exploration
The Library is proud to showcase these examples of the USGS’s role in our nation’s history – from first steps in cartography, to advances in mapping and printing, and into the future with our characteristic scientific excellence.
The USGS Library has created a new exhibit marking the nation’s 250th anniversary by tracing 250 years of scientific discovery, cartographic innovation, and exploration through rare maps, instruments, and imagery from its collection, and objects contributed by other groups including the USGS Museum Program. The Library is proud to showcase these examples of the USGS’s role in our nation’s history – from first steps in cartography, to advances in mapping and printing, and into the future with our characteristic scientific excellence.
Now on display in the USGS National Center Art Hallway in Reston, VA, the exhibit invites staff and visitors to explore how mapping and surveying have shaped the way we understand the United States and the wider world. On display through August 31, the exhibit highlights milestones in the evolution of surveying practices and celebrates the precision, creativity, and curiosity that underpin USGS science.
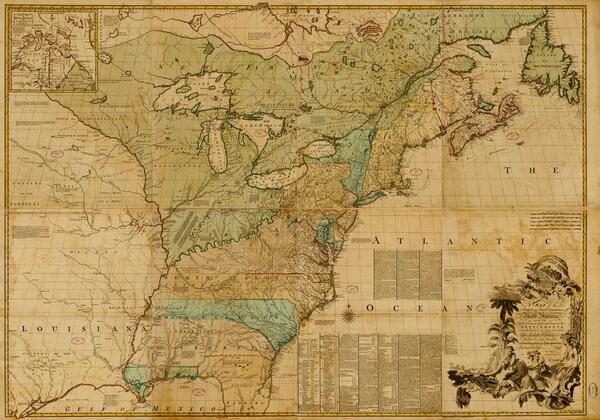
A centerpiece of the exhibit is the Mitchell Map, a landmark 1755 portrayal of British and French dominions in North America by physician and cartographer John Mitchell (Figure 1). The copy on display, a third printing of the first edition recently identified in the USGS Library collection, offers a detailed record of settlements, Indigenous nations, resources, and transportation routes across eastern North America.
The map reflects how cartography was used as a political tool, favoring British territorial claims and depicting the Iroquois Confederacy as subjects of the British Crown, to reinforce imperial authority. Its influence endured long after the colonial era: the Mitchell Map guided boundary discussions during the 1783 Treaty of Paris and was consulted to resolve U.S.-Canada border disputes as late as the 1980s.
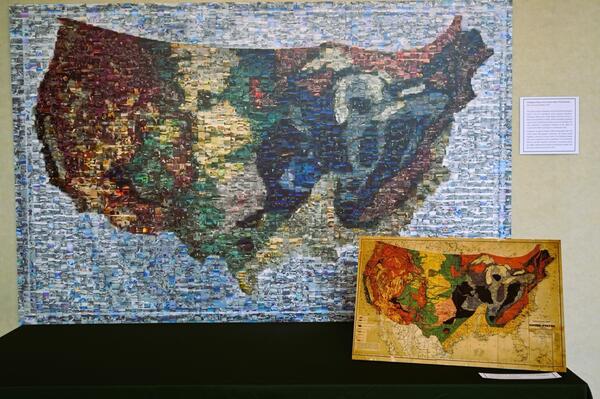
Another highlight is a large-scale photo mosaic, inspired by Charles H. Hitchcock and William P. Blake’s 1873 Geological Map of the United States, one of the earliest attempts to depict the nation’s geology on a continental scale (Figure 2). This contemporary artwork reimagines that historic map using roughly 4,000 photographs from the USGS Library Photographic Collection, spanning expeditions in the American West in the nineteenth century through fieldwork in Antarctica in the 1980s. By weaving these images into a single composition, the mosaic visually connects generations of fieldwork, landscapes, and scientists, illustrating how geological mapping has evolved.
The exhibit also displays stereoscopes, three-dimensional viewing devices that became essential tools for USGS topographers beginning in the late 1930s. When paired with overlapping aerial photographs, stereoscopes create the illusion of depth, allowing users to see terrain in three dimensions, measure elevations, and interpret landforms with greater accuracy.
These instruments range from compact folding models to mirror stereoscopes with adjustable magnification and measuring attachments, as well as stereoplotters, which transformed stereo imagery into detailed topographic maps and contour lines. Together, they show how advances in imaging helped modernize map production and deepen our understanding of the Earth’s surface.
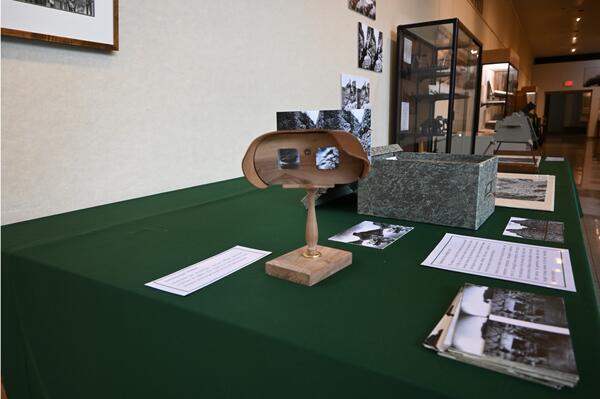
To connect scientific and popular uses of 3D imagery, the exhibit includes reproductions of nineteenth century stereoscopic viewers often used in American homes (Figure 3). The Holmes stereoscope, invented in 1861 by Oliver Wendell Holmes, used a simple arrangement of lenses and a divider to merge paired photographs into a vivid three-dimensional scene.
These affordable devices brought distant landscapes, particularly the American West, into households nationwide, drawing on stereo photographs produced by pioneering photographers such as William Henry Jackson, John Karl Hillers, and Carleton Watkins. Their work helped shape public perceptions of the American West and contributed to the visual record of U.S. expansion.
To round out the exhibit, the display features engraved copper alloy plates used between the 1880s and 1950s to print USGS topographic and geographic maps (Figure 4). Each plate bears a meticulously engraved mirror image of map features, including contour lines, place names, boundaries, and symbols.
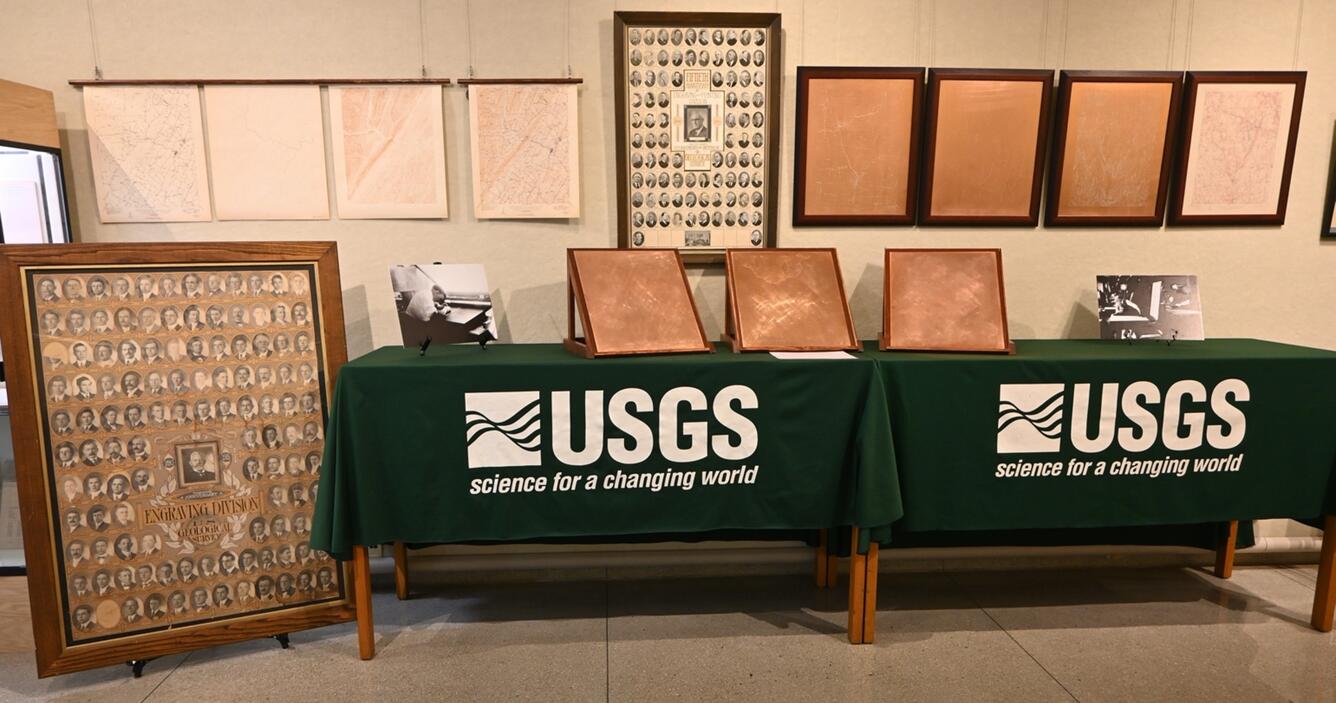
Visitors can see how multiple inked plates, typically black for cultural features and text, blue for rivers and lakes, and brown for topographic contours, were printed in layers to create finished maps. These plates highlight the craft and durability behind the USGS’s printed maps, which continue to shape understanding of the American landscape.
The exhibit was developed by the USGS Library with support from colleagues across the bureau, including John Brown, Alan Ragsdale, and Bryan Landacre in the Operations Branch; Carlin Green in the Geology, Energy, and Minerals Science Center; Brian Pellerin and Harry Padbury in the Water Mission Area; Susan Russell-Robinson (retired) of the Reston Community Engagement Work Group; Bruce Geyman (emeritus) of the USGS Museum Program; and Robert Mason (retired). Thanks to everyone for making this exhibit possible.