
Powell Center by the Numbers - FY24
See metrics for Powell Center publications and working group participants through fiscal year 2024.
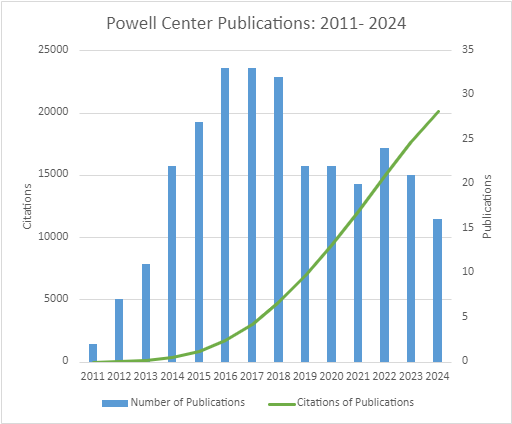
Publications from Powell Center working groups, 2011-2024. The blue bars show the number of publications in that respective year, and the green line shows cumulative citations of those publications over time (over 20,000 by the end of fiscal year 2024).
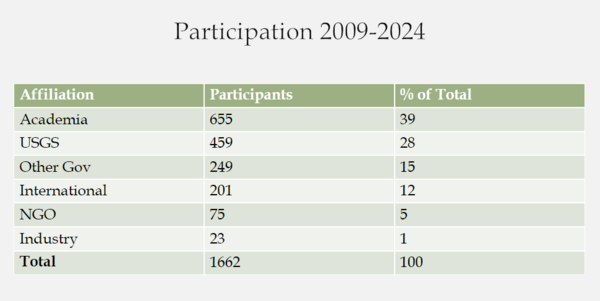
Table showing participant metrics for Powell Center Working Groups, 2009-2024. Table has three columns: Affiliation, Participants, and % of Total Participants. Numbers are as follows: Academia = 655 participants, 39% of total, USGS = 459 participants, 28% of total, Other Government = 249, 15% of total, International = 201 participants, 12% of total, Non Governmental Organizations = 75 participants, 5 % of total, and Industry = 23 participants, 1% of total.